Mycobacterium phage Phatniss
Taxonomy: Viruses; Duplodnaviria; Heunggongvirae; Uroviricota; Caudoviricetes; Caudovirales; Siphoviridae; Cheoctovirus; unclassified Cheoctovirus
Average proteome isoelectric point is 6.12
Get precalculated fractions of proteins
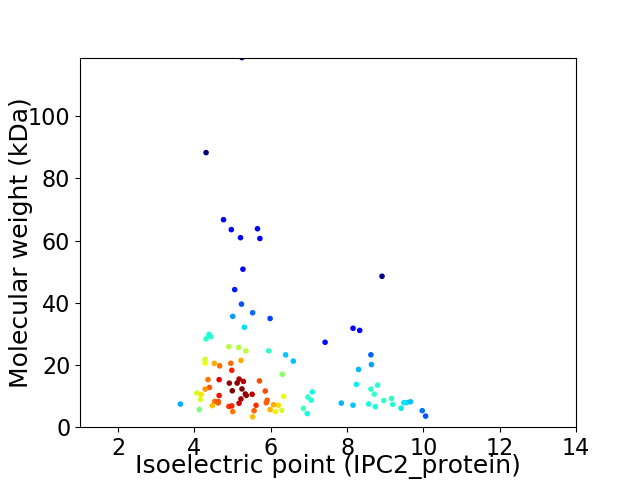
Virtual 2D-PAGE plot for 101 proteins (isoelectric point calculated using IPC2_protein)
Get csv file with sequences according to given criteria:
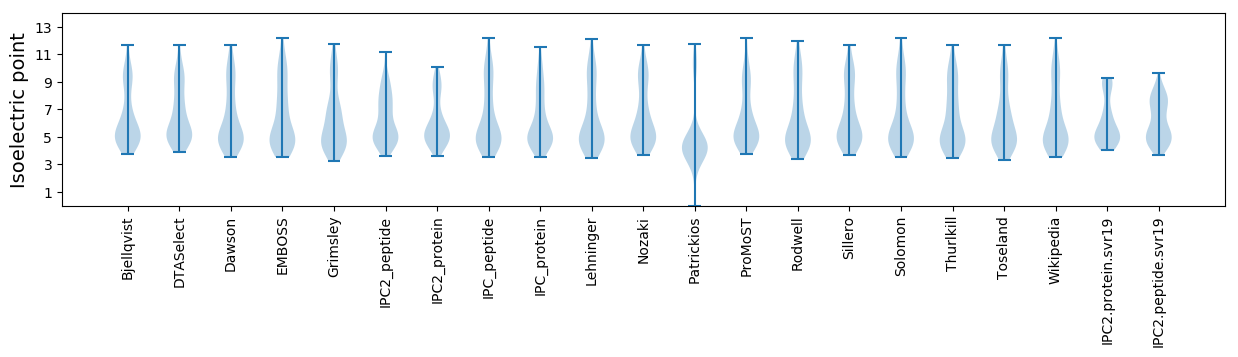
* You can choose from 21 different methods for calculating isoelectric point
Summary statistics related to proteome-wise predictions
Protein with the lowest isoelectric point:
>tr|A0A0K1Y709|A0A0K1Y709_9CAUD Uncharacterized protein OS=Mycobacterium phage Phatniss OX=1698356 GN=PHATNISS_52 PE=4 SV=1
MM1 pKa = 7.92SGEE4 pKa = 4.04INPEE8 pKa = 3.43GFTRR12 pKa = 11.84YY13 pKa = 10.28GGDD16 pKa = 3.72CTCGPIYY23 pKa = 10.21TYY25 pKa = 10.79GGHH28 pKa = 7.13AEE30 pKa = 4.48PGQFDD35 pKa = 4.88PFCPDD40 pKa = 2.8HH41 pKa = 6.95GNPEE45 pKa = 4.29YY46 pKa = 10.83VASLEE51 pKa = 4.27EE52 pKa = 4.01AA53 pKa = 3.67
MM1 pKa = 7.92SGEE4 pKa = 4.04INPEE8 pKa = 3.43GFTRR12 pKa = 11.84YY13 pKa = 10.28GGDD16 pKa = 3.72CTCGPIYY23 pKa = 10.21TYY25 pKa = 10.79GGHH28 pKa = 7.13AEE30 pKa = 4.48PGQFDD35 pKa = 4.88PFCPDD40 pKa = 2.8HH41 pKa = 6.95GNPEE45 pKa = 4.29YY46 pKa = 10.83VASLEE51 pKa = 4.27EE52 pKa = 4.01AA53 pKa = 3.67
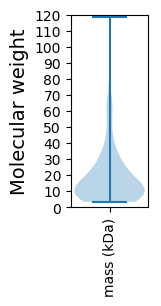
Molecular weight: 5.69 kDa
Isoelectric point according different methods:
Protein with the highest isoelectric point:
>tr|A0A0K1Y756|A0A0K1Y756_9CAUD Uncharacterized protein OS=Mycobacterium phage Phatniss OX=1698356 GN=PHATNISS_97 PE=4 SV=1
MM1 pKa = 7.8AGTAVLTPDD10 pKa = 5.37GIDD13 pKa = 3.45TLVTAAEE20 pKa = 4.08AASLCGVTTSTIYY33 pKa = 10.15VWVNRR38 pKa = 11.84GTLAPSGKK46 pKa = 9.45NRR48 pKa = 11.84LGHH51 pKa = 5.16NVYY54 pKa = 10.31RR55 pKa = 11.84VLDD58 pKa = 3.67VAKK61 pKa = 10.59AEE63 pKa = 4.07HH64 pKa = 6.08ATRR67 pKa = 11.84AKK69 pKa = 10.42ARR71 pKa = 11.84RR72 pKa = 11.84HH73 pKa = 4.63RR74 pKa = 3.93
MM1 pKa = 7.8AGTAVLTPDD10 pKa = 5.37GIDD13 pKa = 3.45TLVTAAEE20 pKa = 4.08AASLCGVTTSTIYY33 pKa = 10.15VWVNRR38 pKa = 11.84GTLAPSGKK46 pKa = 9.45NRR48 pKa = 11.84LGHH51 pKa = 5.16NVYY54 pKa = 10.31RR55 pKa = 11.84VLDD58 pKa = 3.67VAKK61 pKa = 10.59AEE63 pKa = 4.07HH64 pKa = 6.08ATRR67 pKa = 11.84AKK69 pKa = 10.42ARR71 pKa = 11.84RR72 pKa = 11.84HH73 pKa = 4.63RR74 pKa = 3.93
Molecular weight: 7.86 kDa
Isoelectric point according different methods:
Peptides (in silico digests for buttom-up proteomics)
Below you can find in silico digests of the whole proteome with Trypsin, Chymotrypsin, Trypsin+LysC, LysN, ArgC proteases suitable for different mass spec machines.| Try ESI |
 |
|---|
| ChTry ESI |
|
|---|
| ArgC ESI |
|
|---|
| LysN ESI |
|
|---|
| TryLysC ESI |
|
|---|
| Try MALDI |
|
|---|
| ChTry MALDI |
|
|---|
| ArgC MALDI |
|
|---|
| LysN MALDI |
|
|---|
| TryLysC MALDI |
|
|---|
| Try LTQ |
|
|---|
| ChTry LTQ |
|
|---|
| ArgC LTQ |
|
|---|
| LysN LTQ |
|
|---|
| TryLysC LTQ |
|
|---|
| Try MSlow |
|
|---|
| ChTry MSlow |
|
|---|
| ArgC MSlow |
|
|---|
| LysN MSlow |
|
|---|
| TryLysC MSlow |
|
|---|
| Try MShigh |
|
|---|
| ChTry MShigh |
|
|---|
| ArgC MShigh |
|
|---|
| LysN MShigh |
|
|---|
| TryLysC MShigh |
|
|---|
General Statistics
Number of major isoforms |
Number of additional isoforms |
Number of all proteins |
Number of amino acids |
Min. Seq. Length |
Max. Seq. Length |
Avg. Seq. Length |
Avg. Mol. Weight |
|---|---|---|---|---|---|---|---|
0 |
17925 |
30 |
1163 |
177.5 |
19.43 |
Amino acid frequency
Ala |
Cys |
Asp |
Glu |
Phe |
Gly |
His |
Ile |
Lys |
Leu |
|---|---|---|---|---|---|---|---|---|---|
10.628 ± 0.475 | 1.266 ± 0.159 |
6.656 ± 0.228 | 5.886 ± 0.324 |
3.079 ± 0.19 | 8.87 ± 0.534 |
2.377 ± 0.193 | 4.279 ± 0.208 |
3.381 ± 0.17 | 7.091 ± 0.223 |
Met |
Asn |
Gln |
Pro |
Arg |
Ser |
Thr |
Val |
Trp |
Tyr |
|---|---|---|---|---|---|---|---|---|---|
2.215 ± 0.14 | 3.392 ± 0.182 |
6.103 ± 0.214 | 3.358 ± 0.207 |
6.84 ± 0.378 | 5.729 ± 0.265 |
6.762 ± 0.265 | 7.141 ± 0.263 |
2.371 ± 0.15 | 2.577 ± 0.15 |
Most of the basic statistics you can see at this page can be downloaded from this CSV file
See this proteome in:

Proteome-pI is available under Creative Commons Attribution-NoDerivs license, for more details see here
| Reference: Kozlowski LP. Proteome-pI 2.0: Proteome Isoelectric Point Database Update. Nucleic Acids Res. 2021, doi: 10.1093/nar/gkab944 | Contact: Lukasz P. Kozlowski |