Lactococcus phage 98202
Taxonomy: Viruses; Duplodnaviria; Heunggongvirae; Uroviricota; Caudoviricetes; Caudovirales; Siphoviridae; unclassified Siphoviridae
Average proteome isoelectric point is 6.66
Get precalculated fractions of proteins
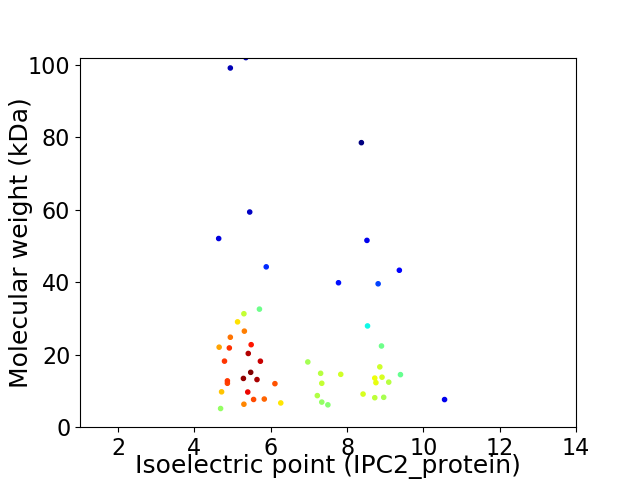
Virtual 2D-PAGE plot for 53 proteins (isoelectric point calculated using IPC2_protein)
Get csv file with sequences according to given criteria:
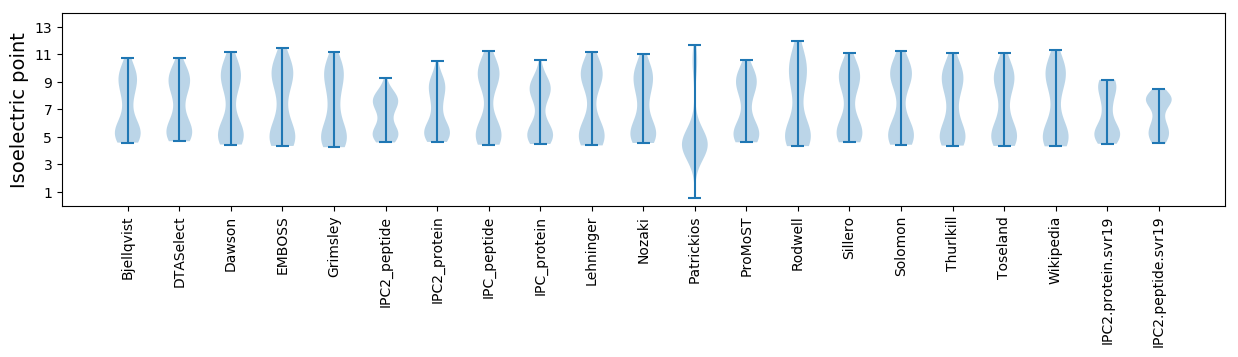
* You can choose from 21 different methods for calculating isoelectric point
Summary statistics related to proteome-wise predictions
Protein with the lowest isoelectric point:
>tr|A0A1P8BM51|A0A1P8BM51_9CAUD Resistance protein OS=Lactococcus phage 98202 OX=1868858 GN=DS98202_18 PE=4 SV=1
MM1 pKa = 7.55KK2 pKa = 9.96CDD4 pKa = 3.13KK5 pKa = 10.52CGNEE9 pKa = 4.13IDD11 pKa = 4.27CDD13 pKa = 4.25CMGCHH18 pKa = 6.48YY19 pKa = 7.79FTQQLHH25 pKa = 5.69PVSLGAYY32 pKa = 8.74EE33 pKa = 4.65SEE35 pKa = 4.45EE36 pKa = 4.04LTKK39 pKa = 10.76DD40 pKa = 3.4KK41 pKa = 11.0QIEE44 pKa = 4.1LL45 pKa = 3.9
MM1 pKa = 7.55KK2 pKa = 9.96CDD4 pKa = 3.13KK5 pKa = 10.52CGNEE9 pKa = 4.13IDD11 pKa = 4.27CDD13 pKa = 4.25CMGCHH18 pKa = 6.48YY19 pKa = 7.79FTQQLHH25 pKa = 5.69PVSLGAYY32 pKa = 8.74EE33 pKa = 4.65SEE35 pKa = 4.45EE36 pKa = 4.04LTKK39 pKa = 10.76DD40 pKa = 3.4KK41 pKa = 11.0QIEE44 pKa = 4.1LL45 pKa = 3.9
Molecular weight: 5.15 kDa
Isoelectric point according different methods:
Protein with the highest isoelectric point:
>tr|A0A1P8BM23|A0A1P8BM23_9CAUD Integrase OS=Lactococcus phage 98202 OX=1868858 GN=DS98202_01 PE=3 SV=1
MM1 pKa = 7.44KK2 pKa = 10.35FGMRR6 pKa = 11.84KK7 pKa = 9.38PSITKK12 pKa = 9.06ILKK15 pKa = 10.36AITTTKK21 pKa = 10.48YY22 pKa = 9.62KK23 pKa = 10.61RR24 pKa = 11.84KK25 pKa = 9.38VKK27 pKa = 10.28KK28 pKa = 10.44ALIPGYY34 pKa = 9.54GKK36 pKa = 10.74KK37 pKa = 10.71GMGWIKK43 pKa = 10.5NPKK46 pKa = 7.92KK47 pKa = 9.89AAYY50 pKa = 9.48NKK52 pKa = 9.59VYY54 pKa = 10.79KK55 pKa = 9.53KK56 pKa = 7.59TTFSIWGLFNN66 pKa = 4.27
MM1 pKa = 7.44KK2 pKa = 10.35FGMRR6 pKa = 11.84KK7 pKa = 9.38PSITKK12 pKa = 9.06ILKK15 pKa = 10.36AITTTKK21 pKa = 10.48YY22 pKa = 9.62KK23 pKa = 10.61RR24 pKa = 11.84KK25 pKa = 9.38VKK27 pKa = 10.28KK28 pKa = 10.44ALIPGYY34 pKa = 9.54GKK36 pKa = 10.74KK37 pKa = 10.71GMGWIKK43 pKa = 10.5NPKK46 pKa = 7.92KK47 pKa = 9.89AAYY50 pKa = 9.48NKK52 pKa = 9.59VYY54 pKa = 10.79KK55 pKa = 9.53KK56 pKa = 7.59TTFSIWGLFNN66 pKa = 4.27
Molecular weight: 7.63 kDa
Isoelectric point according different methods:
Peptides (in silico digests for buttom-up proteomics)
Below you can find in silico digests of the whole proteome with Trypsin, Chymotrypsin, Trypsin+LysC, LysN, ArgC proteases suitable for different mass spec machines.| Try ESI |
 |
|---|
| ChTry ESI |
|
|---|
| ArgC ESI |
|
|---|
| LysN ESI |
|
|---|
| TryLysC ESI |
|
|---|
| Try MALDI |
|
|---|
| ChTry MALDI |
|
|---|
| ArgC MALDI |
|
|---|
| LysN MALDI |
|
|---|
| TryLysC MALDI |
|
|---|
| Try LTQ |
|
|---|
| ChTry LTQ |
|
|---|
| ArgC LTQ |
|
|---|
| LysN LTQ |
|
|---|
| TryLysC LTQ |
|
|---|
| Try MSlow |
|
|---|
| ChTry MSlow |
|
|---|
| ArgC MSlow |
|
|---|
| LysN MSlow |
|
|---|
| TryLysC MSlow |
|
|---|
| Try MShigh |
|
|---|
| ChTry MShigh |
|
|---|
| ArgC MShigh |
|
|---|
| LysN MShigh |
|
|---|
| TryLysC MShigh |
|
|---|
General Statistics
Number of major isoforms |
Number of additional isoforms |
Number of all proteins |
Number of amino acids |
Min. Seq. Length |
Max. Seq. Length |
Avg. Seq. Length |
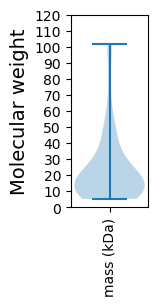
Avg. Mol. Weight |
|---|---|---|---|---|---|---|---|
0 |
11063 |
45 |
918 |
208.7 |
23.72 |
Amino acid frequency
Ala |
Cys |
Asp |
Glu |
Phe |
Gly |
His |
Ile |
Lys |
Leu |
|---|---|---|---|---|---|---|---|---|---|
6.237 ± 0.306 | 0.597 ± 0.115 |
6.11 ± 0.187 | 7.041 ± 0.653 |
4.601 ± 0.185 | 6.309 ± 0.549 |
1.428 ± 0.182 | 7.105 ± 0.376 |
9.383 ± 0.654 | 7.873 ± 0.332 |
Met |
Asn |
Gln |
Pro |
Arg |
Ser |
Thr |
Val |
Trp |
Tyr |
|---|---|---|---|---|---|---|---|---|---|
2.45 ± 0.164 | 6.183 ± 0.317 |
2.748 ± 0.205 | 4.239 ± 0.301 |
3.679 ± 0.292 | 6.463 ± 0.382 |
6.291 ± 0.276 | 5.785 ± 0.291 |
1.338 ± 0.122 | 4.14 ± 0.281 |
Most of the basic statistics you can see at this page can be downloaded from this CSV file
See this proteome in:

Proteome-pI is available under Creative Commons Attribution-NoDerivs license, for more details see here
| Reference: Kozlowski LP. Proteome-pI 2.0: Proteome Isoelectric Point Database Update. Nucleic Acids Res. 2021, doi: 10.1093/nar/gkab944 | Contact: Lukasz P. Kozlowski |