Photobacterium ganghwense
Taxonomy: cellular organisms; Bacteria; Proteobacteria; Gammaproteobacteria; Vibrionales; Vibrionaceae; Photobacterium
Average proteome isoelectric point is 6.11
Get precalculated fractions of proteins
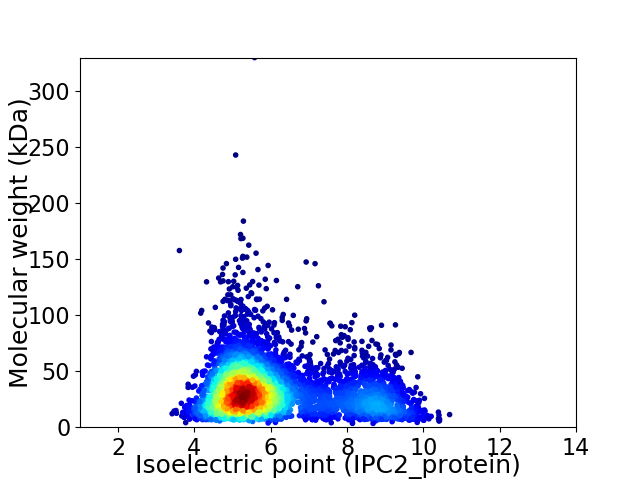
Virtual 2D-PAGE plot for 4693 proteins (isoelectric point calculated using IPC2_protein)
Get csv file with sequences according to given criteria:
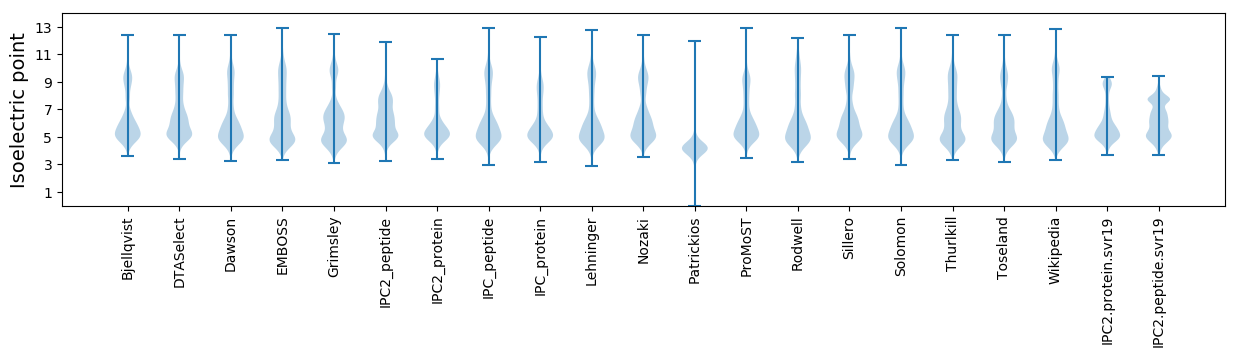
* You can choose from 21 different methods for calculating isoelectric point
Summary statistics related to proteome-wise predictions
Protein with the lowest isoelectric point:
>tr|A0A0J1GY41|A0A0J1GY41_9GAMM ABC transporter OS=Photobacterium ganghwense OX=320778 GN=ABT57_23705 PE=4 SV=1
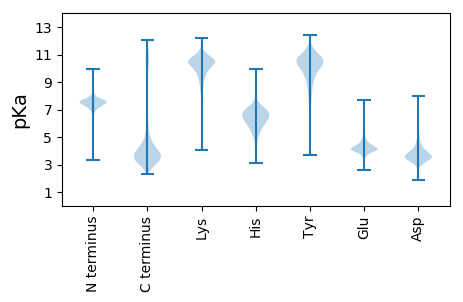
MM1 pKa = 7.56KK2 pKa = 8.99KK3 pKa = 8.34TVVAAVIGSVVASASAMAAEE23 pKa = 5.17VYY25 pKa = 10.57KK26 pKa = 10.92SDD28 pKa = 3.89DD29 pKa = 3.64LSVNIYY35 pKa = 10.0GNLRR39 pKa = 11.84VRR41 pKa = 11.84YY42 pKa = 7.01EE43 pKa = 4.07TTDD46 pKa = 3.37NGIMGADD53 pKa = 3.43DD54 pKa = 3.81TFTGEE59 pKa = 4.12GTEE62 pKa = 4.52LGLNMTYY69 pKa = 10.82FMPNGLYY76 pKa = 11.04VNGDD80 pKa = 3.5VLKK83 pKa = 9.66EE84 pKa = 3.88LNIIPEE90 pKa = 4.66DD91 pKa = 3.74GNGFDD96 pKa = 5.73DD97 pKa = 5.0EE98 pKa = 4.95EE99 pKa = 4.28FTKK102 pKa = 10.63FASAAIGGDD111 pKa = 3.18FGEE114 pKa = 4.27FRR116 pKa = 11.84IGRR119 pKa = 11.84MSAVQDD125 pKa = 3.88TLAGQYY131 pKa = 10.68DD132 pKa = 3.94ITWEE136 pKa = 4.05YY137 pKa = 11.3GGTANIKK144 pKa = 9.96NDD146 pKa = 2.85WSATDD151 pKa = 3.35RR152 pKa = 11.84LTNGVQYY159 pKa = 10.9KK160 pKa = 9.51FEE162 pKa = 4.97KK163 pKa = 10.83NGFTVMAQYY172 pKa = 8.28HH173 pKa = 6.02TGQEE177 pKa = 3.9YY178 pKa = 10.7DD179 pKa = 4.04DD180 pKa = 4.71RR181 pKa = 11.84DD182 pKa = 3.75GVISGDD188 pKa = 3.78IIEE191 pKa = 4.91IDD193 pKa = 3.05QAYY196 pKa = 9.97ALGVAWEE203 pKa = 4.31SDD205 pKa = 3.44FGLGLSGTYY214 pKa = 9.18TSSEE218 pKa = 3.82RR219 pKa = 11.84TEE221 pKa = 3.82KK222 pKa = 10.96DD223 pKa = 3.24KK224 pKa = 11.8NFGDD228 pKa = 5.02DD229 pKa = 5.81KK230 pKa = 11.49DD231 pKa = 5.3DD232 pKa = 3.63SWTLNATYY240 pKa = 10.36AWNSLSLAAMYY251 pKa = 10.68SDD253 pKa = 4.23YY254 pKa = 11.58DD255 pKa = 3.63FAGDD259 pKa = 3.52EE260 pKa = 4.18QTGVGAMVRR269 pKa = 11.84YY270 pKa = 9.11DD271 pKa = 3.45FPIGVGLYY279 pKa = 10.09GVYY282 pKa = 10.3DD283 pKa = 3.75YY284 pKa = 11.97VDD286 pKa = 4.16YY287 pKa = 8.82DD288 pKa = 3.95TKK290 pKa = 11.68DD291 pKa = 3.14NTLDD295 pKa = 3.47QFTVGADD302 pKa = 3.3YY303 pKa = 10.72WLTSQVVSYY312 pKa = 9.99MEE314 pKa = 4.24YY315 pKa = 11.09ADD317 pKa = 3.6MSYY320 pKa = 11.15DD321 pKa = 3.79EE322 pKa = 5.49EE323 pKa = 4.22KK324 pKa = 10.3TAIDD328 pKa = 4.16GQKK331 pKa = 10.31MMDD334 pKa = 4.05DD335 pKa = 3.62SAFTIGMRR343 pKa = 11.84LYY345 pKa = 10.62FF346 pKa = 4.33
MM1 pKa = 7.56KK2 pKa = 8.99KK3 pKa = 8.34TVVAAVIGSVVASASAMAAEE23 pKa = 5.17VYY25 pKa = 10.57KK26 pKa = 10.92SDD28 pKa = 3.89DD29 pKa = 3.64LSVNIYY35 pKa = 10.0GNLRR39 pKa = 11.84VRR41 pKa = 11.84YY42 pKa = 7.01EE43 pKa = 4.07TTDD46 pKa = 3.37NGIMGADD53 pKa = 3.43DD54 pKa = 3.81TFTGEE59 pKa = 4.12GTEE62 pKa = 4.52LGLNMTYY69 pKa = 10.82FMPNGLYY76 pKa = 11.04VNGDD80 pKa = 3.5VLKK83 pKa = 9.66EE84 pKa = 3.88LNIIPEE90 pKa = 4.66DD91 pKa = 3.74GNGFDD96 pKa = 5.73DD97 pKa = 5.0EE98 pKa = 4.95EE99 pKa = 4.28FTKK102 pKa = 10.63FASAAIGGDD111 pKa = 3.18FGEE114 pKa = 4.27FRR116 pKa = 11.84IGRR119 pKa = 11.84MSAVQDD125 pKa = 3.88TLAGQYY131 pKa = 10.68DD132 pKa = 3.94ITWEE136 pKa = 4.05YY137 pKa = 11.3GGTANIKK144 pKa = 9.96NDD146 pKa = 2.85WSATDD151 pKa = 3.35RR152 pKa = 11.84LTNGVQYY159 pKa = 10.9KK160 pKa = 9.51FEE162 pKa = 4.97KK163 pKa = 10.83NGFTVMAQYY172 pKa = 8.28HH173 pKa = 6.02TGQEE177 pKa = 3.9YY178 pKa = 10.7DD179 pKa = 4.04DD180 pKa = 4.71RR181 pKa = 11.84DD182 pKa = 3.75GVISGDD188 pKa = 3.78IIEE191 pKa = 4.91IDD193 pKa = 3.05QAYY196 pKa = 9.97ALGVAWEE203 pKa = 4.31SDD205 pKa = 3.44FGLGLSGTYY214 pKa = 9.18TSSEE218 pKa = 3.82RR219 pKa = 11.84TEE221 pKa = 3.82KK222 pKa = 10.96DD223 pKa = 3.24KK224 pKa = 11.8NFGDD228 pKa = 5.02DD229 pKa = 5.81KK230 pKa = 11.49DD231 pKa = 5.3DD232 pKa = 3.63SWTLNATYY240 pKa = 10.36AWNSLSLAAMYY251 pKa = 10.68SDD253 pKa = 4.23YY254 pKa = 11.58DD255 pKa = 3.63FAGDD259 pKa = 3.52EE260 pKa = 4.18QTGVGAMVRR269 pKa = 11.84YY270 pKa = 9.11DD271 pKa = 3.45FPIGVGLYY279 pKa = 10.09GVYY282 pKa = 10.3DD283 pKa = 3.75YY284 pKa = 11.97VDD286 pKa = 4.16YY287 pKa = 8.82DD288 pKa = 3.95TKK290 pKa = 11.68DD291 pKa = 3.14NTLDD295 pKa = 3.47QFTVGADD302 pKa = 3.3YY303 pKa = 10.72WLTSQVVSYY312 pKa = 9.99MEE314 pKa = 4.24YY315 pKa = 11.09ADD317 pKa = 3.6MSYY320 pKa = 11.15DD321 pKa = 3.79EE322 pKa = 5.49EE323 pKa = 4.22KK324 pKa = 10.3TAIDD328 pKa = 4.16GQKK331 pKa = 10.31MMDD334 pKa = 4.05DD335 pKa = 3.62SAFTIGMRR343 pKa = 11.84LYY345 pKa = 10.62FF346 pKa = 4.33
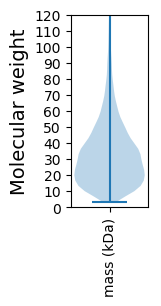
Molecular weight: 38.3 kDa
Isoelectric point according different methods:
Protein with the highest isoelectric point:
>tr|A0A0J1HGW1|A0A0J1HGW1_9GAMM MarR family transcriptional regulator OS=Photobacterium ganghwense OX=320778 GN=ABT57_05215 PE=4 SV=1
MM1 pKa = 7.43PRR3 pKa = 11.84QVIKK7 pKa = 11.0RR8 pKa = 11.84MMPSHH13 pKa = 6.28EE14 pKa = 4.15VIKK17 pKa = 10.33RR18 pKa = 11.84QKK20 pKa = 9.88ALKK23 pKa = 10.18IFGNVLYY30 pKa = 10.72NPNLWCLNRR39 pKa = 11.84RR40 pKa = 11.84SASGAFAVGLFMAFVPLPSQMIMAAGLAILFSVNLPLSVCLVWVSNPITMPVLFYY95 pKa = 10.88GAYY98 pKa = 9.8KK99 pKa = 10.2IGAWLLNTPHH109 pKa = 6.57QSFHH113 pKa = 7.33FEE115 pKa = 4.14LSWDD119 pKa = 3.62FLMSQMNQIGPPFLLGCMICGVGCALVGYY148 pKa = 9.35FGIRR152 pKa = 11.84GLWRR156 pKa = 11.84YY157 pKa = 9.89SVVRR161 pKa = 11.84SWQKK165 pKa = 10.2RR166 pKa = 11.84KK167 pKa = 9.73FRR169 pKa = 11.84VLRR172 pKa = 4.07
MM1 pKa = 7.43PRR3 pKa = 11.84QVIKK7 pKa = 11.0RR8 pKa = 11.84MMPSHH13 pKa = 6.28EE14 pKa = 4.15VIKK17 pKa = 10.33RR18 pKa = 11.84QKK20 pKa = 9.88ALKK23 pKa = 10.18IFGNVLYY30 pKa = 10.72NPNLWCLNRR39 pKa = 11.84RR40 pKa = 11.84SASGAFAVGLFMAFVPLPSQMIMAAGLAILFSVNLPLSVCLVWVSNPITMPVLFYY95 pKa = 10.88GAYY98 pKa = 9.8KK99 pKa = 10.2IGAWLLNTPHH109 pKa = 6.57QSFHH113 pKa = 7.33FEE115 pKa = 4.14LSWDD119 pKa = 3.62FLMSQMNQIGPPFLLGCMICGVGCALVGYY148 pKa = 9.35FGIRR152 pKa = 11.84GLWRR156 pKa = 11.84YY157 pKa = 9.89SVVRR161 pKa = 11.84SWQKK165 pKa = 10.2RR166 pKa = 11.84KK167 pKa = 9.73FRR169 pKa = 11.84VLRR172 pKa = 4.07
Molecular weight: 19.59 kDa
Isoelectric point according different methods:
Peptides (in silico digests for buttom-up proteomics)
Below you can find in silico digests of the whole proteome with Trypsin, Chymotrypsin, Trypsin+LysC, LysN, ArgC proteases suitable for different mass spec machines.| Try ESI |
 |
|---|
| ChTry ESI |
|
|---|
| ArgC ESI |
|
|---|
| LysN ESI |
|
|---|
| TryLysC ESI |
|
|---|
| Try MALDI |
|
|---|
| ChTry MALDI |
|
|---|
| ArgC MALDI |
|
|---|
| LysN MALDI |
|
|---|
| TryLysC MALDI |
|
|---|
| Try LTQ |
|
|---|
| ChTry LTQ |
|
|---|
| ArgC LTQ |
|
|---|
| LysN LTQ |
|
|---|
| TryLysC LTQ |
|
|---|
| Try MSlow |
|
|---|
| ChTry MSlow |
|
|---|
| ArgC MSlow |
|
|---|
| LysN MSlow |
|
|---|
| TryLysC MSlow |
|
|---|
| Try MShigh |
|
|---|
| ChTry MShigh |
|
|---|
| ArgC MShigh |
|
|---|
| LysN MShigh |
|
|---|
| TryLysC MShigh |
|
|---|
General Statistics
Number of major isoforms |
Number of additional isoforms |
Number of all proteins |
Number of amino acids |
Min. Seq. Length |
Max. Seq. Length |
Avg. Seq. Length |
Avg. Mol. Weight |
|---|---|---|---|---|---|---|---|
0 |
1473747 |
29 |
2939 |
314.0 |
34.77 |
Amino acid frequency
Ala |
Cys |
Asp |
Glu |
Phe |
Gly |
His |
Ile |
Lys |
Leu |
|---|---|---|---|---|---|---|---|---|---|
9.442 ± 0.037 | 1.099 ± 0.013 |
5.437 ± 0.027 | 6.079 ± 0.032 |
3.946 ± 0.023 | 7.082 ± 0.032 |
2.35 ± 0.018 | 5.865 ± 0.027 |
4.595 ± 0.028 | 10.563 ± 0.044 |
Met |
Asn |
Gln |
Pro |
Arg |
Ser |
Thr |
Val |
Trp |
Tyr |
|---|---|---|---|---|---|---|---|---|---|
2.812 ± 0.019 | 3.797 ± 0.025 |
4.273 ± 0.022 | 4.644 ± 0.031 |
5.052 ± 0.03 | 6.184 ± 0.026 |
5.421 ± 0.024 | 7.082 ± 0.029 |
1.305 ± 0.015 | 2.972 ± 0.021 |
Most of the basic statistics you can see at this page can be downloaded from this CSV file
See this proteome in:

Proteome-pI is available under Creative Commons Attribution-NoDerivs license, for more details see here
| Reference: Kozlowski LP. Proteome-pI 2.0: Proteome Isoelectric Point Database Update. Nucleic Acids Res. 2021, doi: 10.1093/nar/gkab944 | Contact: Lukasz P. Kozlowski |