Neorhizobium sp. JUb45
Taxonomy: cellular organisms; Bacteria; Proteobacteria; Alphaproteobacteria; Hyphomicrobiales; Rhizobiaceae; Rhizobium/Agrobacterium group; Neorhizobium; unclassified Neorhizobium
Average proteome isoelectric point is 6.39
Get precalculated fractions of proteins
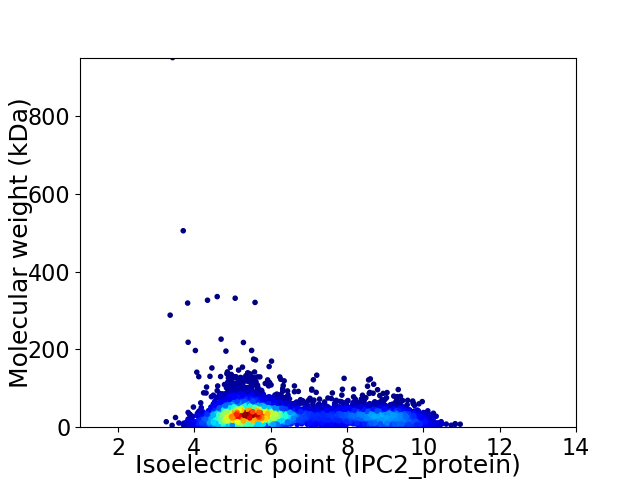
Virtual 2D-PAGE plot for 5878 proteins (isoelectric point calculated using IPC2_protein)
Get csv file with sequences according to given criteria:
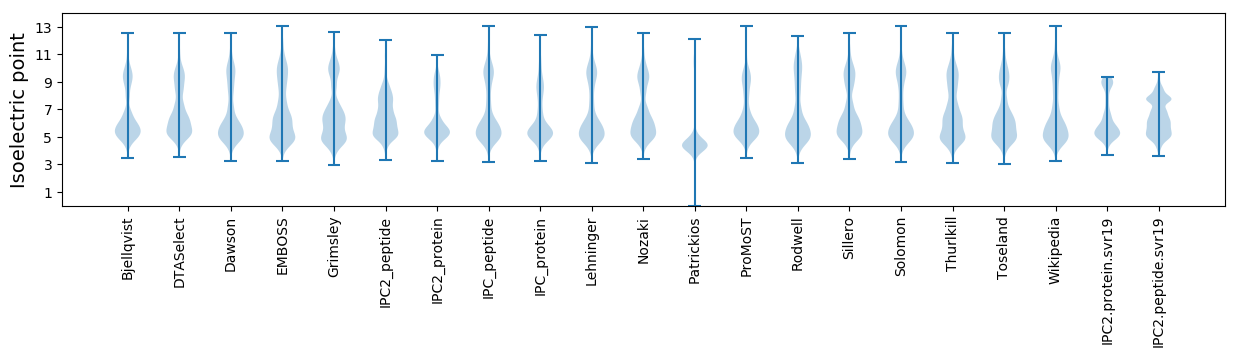
* You can choose from 21 different methods for calculating isoelectric point
Summary statistics related to proteome-wise predictions
Protein with the lowest isoelectric point:
>tr|A0A4R3ADZ1|A0A4R3ADZ1_9RHIZ 4-phosphoerythronate dehydrogenase (FAD-dependent) OS=Neorhizobium sp. JUb45 OX=2485113 GN=EDF70_102297 PE=4 SV=1
MM1 pKa = 7.49NIKK4 pKa = 10.39SLLLGSAAALAAVSGAQAADD24 pKa = 4.21AIVAAEE30 pKa = 4.47PEE32 pKa = 3.93PMEE35 pKa = 4.1YY36 pKa = 10.8VRR38 pKa = 11.84VCDD41 pKa = 4.42AFGTGYY47 pKa = 10.47FYY49 pKa = 10.57IPGTEE54 pKa = 3.83TCLKK58 pKa = 9.4IGGYY62 pKa = 9.81VRR64 pKa = 11.84TQIGGRR70 pKa = 11.84SDD72 pKa = 3.77FDD74 pKa = 3.63IDD76 pKa = 3.88GVGRR80 pKa = 11.84VQDD83 pKa = 3.51GGYY86 pKa = 7.86ITNTRR91 pKa = 11.84GYY93 pKa = 8.78LTISAKK99 pKa = 10.43SDD101 pKa = 3.59TEE103 pKa = 4.28LGTLGSSISMEE114 pKa = 4.06ADD116 pKa = 3.29TNGGSQDD123 pKa = 3.51FFVDD127 pKa = 3.58EE128 pKa = 5.27AIITLGGLQVGYY140 pKa = 9.82FYY142 pKa = 11.29NYY144 pKa = 9.56FDD146 pKa = 4.02NGLPGEE152 pKa = 4.55TVLSDD157 pKa = 3.5GGPIAGANYY166 pKa = 9.98IGGDD170 pKa = 3.56TLNNSIRR177 pKa = 11.84YY178 pKa = 6.42TFDD181 pKa = 2.88GGAFQAYY188 pKa = 8.59IQGDD192 pKa = 3.88FFDD195 pKa = 5.4SQDD198 pKa = 3.04GWKK201 pKa = 9.16TDD203 pKa = 3.49VNDD206 pKa = 3.6EE207 pKa = 4.4EE208 pKa = 4.82IGINAMIAGKK218 pKa = 10.15FGGVAIDD225 pKa = 4.15LFGAYY230 pKa = 9.64EE231 pKa = 4.17FDD233 pKa = 4.19NEE235 pKa = 4.57DD236 pKa = 3.19GVIASTLAAEE246 pKa = 4.96IGPGTLGVFGVYY258 pKa = 10.21SFGPSRR264 pKa = 11.84YY265 pKa = 7.94WDD267 pKa = 3.78FSEE270 pKa = 3.92WSIGAEE276 pKa = 3.84YY277 pKa = 10.27AIAVSDD283 pKa = 3.98KK284 pKa = 11.45LKK286 pKa = 9.26ITPGAQYY293 pKa = 9.74WDD295 pKa = 4.22NILPIGSDD303 pKa = 3.85YY304 pKa = 11.46EE305 pKa = 4.47GGSAWRR311 pKa = 11.84VGVTADD317 pKa = 3.48YY318 pKa = 9.67TITTNLTAKK327 pKa = 9.65ATVNYY332 pKa = 9.57TDD334 pKa = 3.23VDD336 pKa = 3.64VDD338 pKa = 4.01FGGVGGGDD346 pKa = 2.73RR347 pKa = 11.84WDD349 pKa = 3.45GFVRR353 pKa = 11.84LQRR356 pKa = 11.84SFF358 pKa = 3.42
MM1 pKa = 7.49NIKK4 pKa = 10.39SLLLGSAAALAAVSGAQAADD24 pKa = 4.21AIVAAEE30 pKa = 4.47PEE32 pKa = 3.93PMEE35 pKa = 4.1YY36 pKa = 10.8VRR38 pKa = 11.84VCDD41 pKa = 4.42AFGTGYY47 pKa = 10.47FYY49 pKa = 10.57IPGTEE54 pKa = 3.83TCLKK58 pKa = 9.4IGGYY62 pKa = 9.81VRR64 pKa = 11.84TQIGGRR70 pKa = 11.84SDD72 pKa = 3.77FDD74 pKa = 3.63IDD76 pKa = 3.88GVGRR80 pKa = 11.84VQDD83 pKa = 3.51GGYY86 pKa = 7.86ITNTRR91 pKa = 11.84GYY93 pKa = 8.78LTISAKK99 pKa = 10.43SDD101 pKa = 3.59TEE103 pKa = 4.28LGTLGSSISMEE114 pKa = 4.06ADD116 pKa = 3.29TNGGSQDD123 pKa = 3.51FFVDD127 pKa = 3.58EE128 pKa = 5.27AIITLGGLQVGYY140 pKa = 9.82FYY142 pKa = 11.29NYY144 pKa = 9.56FDD146 pKa = 4.02NGLPGEE152 pKa = 4.55TVLSDD157 pKa = 3.5GGPIAGANYY166 pKa = 9.98IGGDD170 pKa = 3.56TLNNSIRR177 pKa = 11.84YY178 pKa = 6.42TFDD181 pKa = 2.88GGAFQAYY188 pKa = 8.59IQGDD192 pKa = 3.88FFDD195 pKa = 5.4SQDD198 pKa = 3.04GWKK201 pKa = 9.16TDD203 pKa = 3.49VNDD206 pKa = 3.6EE207 pKa = 4.4EE208 pKa = 4.82IGINAMIAGKK218 pKa = 10.15FGGVAIDD225 pKa = 4.15LFGAYY230 pKa = 9.64EE231 pKa = 4.17FDD233 pKa = 4.19NEE235 pKa = 4.57DD236 pKa = 3.19GVIASTLAAEE246 pKa = 4.96IGPGTLGVFGVYY258 pKa = 10.21SFGPSRR264 pKa = 11.84YY265 pKa = 7.94WDD267 pKa = 3.78FSEE270 pKa = 3.92WSIGAEE276 pKa = 3.84YY277 pKa = 10.27AIAVSDD283 pKa = 3.98KK284 pKa = 11.45LKK286 pKa = 9.26ITPGAQYY293 pKa = 9.74WDD295 pKa = 4.22NILPIGSDD303 pKa = 3.85YY304 pKa = 11.46EE305 pKa = 4.47GGSAWRR311 pKa = 11.84VGVTADD317 pKa = 3.48YY318 pKa = 9.67TITTNLTAKK327 pKa = 9.65ATVNYY332 pKa = 9.57TDD334 pKa = 3.23VDD336 pKa = 3.64VDD338 pKa = 4.01FGGVGGGDD346 pKa = 2.73RR347 pKa = 11.84WDD349 pKa = 3.45GFVRR353 pKa = 11.84LQRR356 pKa = 11.84SFF358 pKa = 3.42
Molecular weight: 37.91 kDa
Isoelectric point according different methods:
Protein with the highest isoelectric point:
>tr|A0A4R3A5P7|A0A4R3A5P7_9RHIZ Ammonium transporter OS=Neorhizobium sp. JUb45 OX=2485113 GN=EDF70_105288 PE=3 SV=1
MM1 pKa = 7.56TSLINQIVSGVVEE14 pKa = 4.42SVVKK18 pKa = 10.27EE19 pKa = 3.99LLGKK23 pKa = 9.37SHH25 pKa = 6.35GRR27 pKa = 11.84TASKK31 pKa = 10.08RR32 pKa = 11.84RR33 pKa = 11.84KK34 pKa = 8.74RR35 pKa = 11.84QAKK38 pKa = 8.99AATRR42 pKa = 11.84STTTGRR48 pKa = 11.84FTRR51 pKa = 11.84KK52 pKa = 5.19TTKK55 pKa = 10.27KK56 pKa = 9.33AAKK59 pKa = 8.75PARR62 pKa = 11.84KK63 pKa = 8.73QVSRR67 pKa = 11.84RR68 pKa = 11.84RR69 pKa = 11.84TAVSRR74 pKa = 11.84SKK76 pKa = 10.59QRR78 pKa = 11.84SRR80 pKa = 3.52
MM1 pKa = 7.56TSLINQIVSGVVEE14 pKa = 4.42SVVKK18 pKa = 10.27EE19 pKa = 3.99LLGKK23 pKa = 9.37SHH25 pKa = 6.35GRR27 pKa = 11.84TASKK31 pKa = 10.08RR32 pKa = 11.84RR33 pKa = 11.84KK34 pKa = 8.74RR35 pKa = 11.84QAKK38 pKa = 8.99AATRR42 pKa = 11.84STTTGRR48 pKa = 11.84FTRR51 pKa = 11.84KK52 pKa = 5.19TTKK55 pKa = 10.27KK56 pKa = 9.33AAKK59 pKa = 8.75PARR62 pKa = 11.84KK63 pKa = 8.73QVSRR67 pKa = 11.84RR68 pKa = 11.84RR69 pKa = 11.84TAVSRR74 pKa = 11.84SKK76 pKa = 10.59QRR78 pKa = 11.84SRR80 pKa = 3.52
Molecular weight: 8.95 kDa
Isoelectric point according different methods:
Peptides (in silico digests for buttom-up proteomics)
Below you can find in silico digests of the whole proteome with Trypsin, Chymotrypsin, Trypsin+LysC, LysN, ArgC proteases suitable for different mass spec machines.| Try ESI |
 |
|---|
| ChTry ESI |
|
|---|
| ArgC ESI |
|
|---|
| LysN ESI |
|
|---|
| TryLysC ESI |
|
|---|
| Try MALDI |
|
|---|
| ChTry MALDI |
|
|---|
| ArgC MALDI |
|
|---|
| LysN MALDI |
|
|---|
| TryLysC MALDI |
|
|---|
| Try LTQ |
|
|---|
| ChTry LTQ |
|
|---|
| ArgC LTQ |
|
|---|
| LysN LTQ |
|
|---|
| TryLysC LTQ |
|
|---|
| Try MSlow |
|
|---|
| ChTry MSlow |
|
|---|
| ArgC MSlow |
|
|---|
| LysN MSlow |
|
|---|
| TryLysC MSlow |
|
|---|
| Try MShigh |
|
|---|
| ChTry MShigh |
|
|---|
| ArgC MShigh |
|
|---|
| LysN MShigh |
|
|---|
| TryLysC MShigh |
|
|---|
General Statistics
Number of major isoforms |
Number of additional isoforms |
Number of all proteins |
Number of amino acids |
Min. Seq. Length |
Max. Seq. Length |
Avg. Seq. Length |
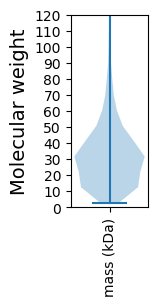
Avg. Mol. Weight |
|---|---|---|---|---|---|---|---|
0 |
1828676 |
27 |
9415 |
311.1 |
33.8 |
Amino acid frequency
Ala |
Cys |
Asp |
Glu |
Phe |
Gly |
His |
Ile |
Lys |
Leu |
|---|---|---|---|---|---|---|---|---|---|
11.784 ± 0.043 | 0.743 ± 0.011 |
5.784 ± 0.032 | 5.677 ± 0.038 |
3.901 ± 0.021 | 8.351 ± 0.04 |
1.981 ± 0.019 | 5.767 ± 0.021 |
3.753 ± 0.032 | 9.812 ± 0.042 |
Met |
Asn |
Gln |
Pro |
Arg |
Ser |
Thr |
Val |
Trp |
Tyr |
|---|---|---|---|---|---|---|---|---|---|
2.653 ± 0.021 | 2.947 ± 0.026 |
4.839 ± 0.026 | 3.196 ± 0.02 |
6.397 ± 0.039 | 5.916 ± 0.03 |
5.628 ± 0.054 | 7.328 ± 0.035 |
1.251 ± 0.015 | 2.292 ± 0.019 |
Most of the basic statistics you can see at this page can be downloaded from this CSV file
See this proteome in:

Proteome-pI is available under Creative Commons Attribution-NoDerivs license, for more details see here
| Reference: Kozlowski LP. Proteome-pI 2.0: Proteome Isoelectric Point Database Update. Nucleic Acids Res. 2021, doi: 10.1093/nar/gkab944 | Contact: Lukasz P. Kozlowski |