Paenibacillus uliginis N3/975
Taxonomy: cellular organisms; Bacteria; Terrabacteria group; Firmicutes; Bacilli; Bacillales; Paenibacillaceae; Paenibacillus; Paenibacillus uliginis
Average proteome isoelectric point is 6.25
Get precalculated fractions of proteins
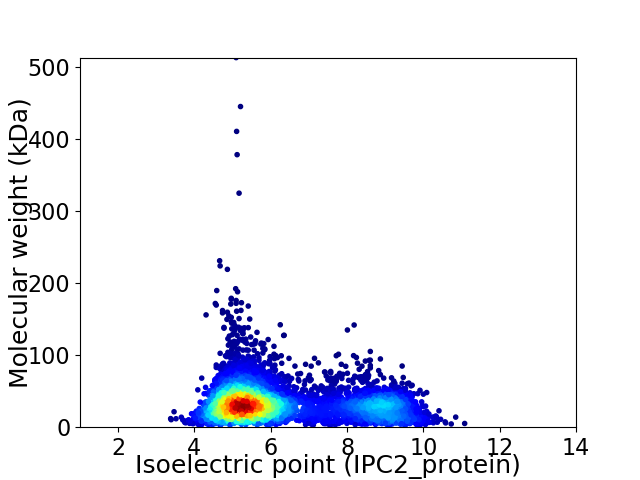
Virtual 2D-PAGE plot for 5718 proteins (isoelectric point calculated using IPC2_protein)
Get csv file with sequences according to given criteria:
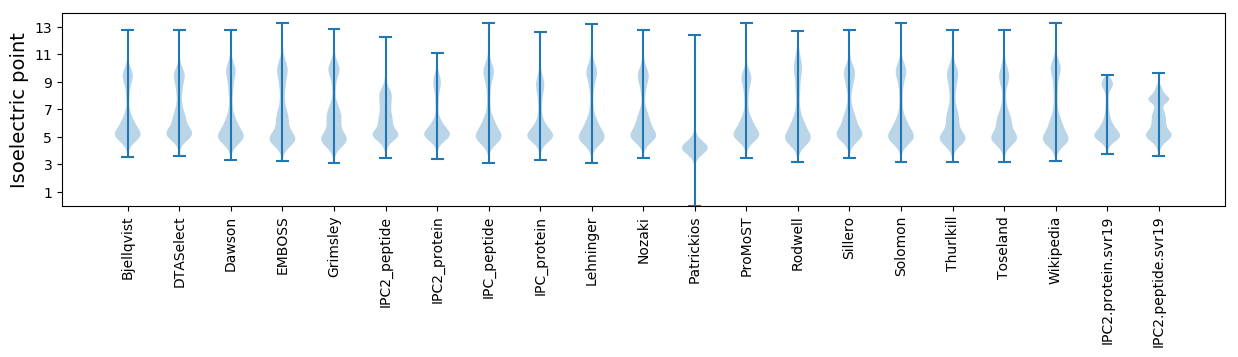
* You can choose from 21 different methods for calculating isoelectric point
Summary statistics related to proteome-wise predictions
Protein with the lowest isoelectric point:
>tr|A0A1X7H1Y2|A0A1X7H1Y2_9BACL Carbohydrate ABC transporter membrane protein 1 CUT1 family OS=Paenibacillus uliginis N3/975 OX=1313296 GN=SAMN05661091_1452 PE=3 SV=1
MM1 pKa = 6.73TTDD4 pKa = 3.78HH5 pKa = 6.88SSSGQALGYY14 pKa = 10.21VYY16 pKa = 10.55QFDD19 pKa = 3.81RR20 pKa = 11.84ATYY23 pKa = 10.11RR24 pKa = 11.84LFQSGVDD31 pKa = 3.51VVEE34 pKa = 4.88IGVEE38 pKa = 4.41DD39 pKa = 3.73IDD41 pKa = 4.65EE42 pKa = 4.21EE43 pKa = 4.43
MM1 pKa = 6.73TTDD4 pKa = 3.78HH5 pKa = 6.88SSSGQALGYY14 pKa = 10.21VYY16 pKa = 10.55QFDD19 pKa = 3.81RR20 pKa = 11.84ATYY23 pKa = 10.11RR24 pKa = 11.84LFQSGVDD31 pKa = 3.51VVEE34 pKa = 4.88IGVEE38 pKa = 4.41DD39 pKa = 3.73IDD41 pKa = 4.65EE42 pKa = 4.21EE43 pKa = 4.43
Molecular weight: 4.83 kDa
Isoelectric point according different methods:
Protein with the highest isoelectric point:
>tr|A0A1X7HUD2|A0A1X7HUD2_9BACL Uncharacterized protein OS=Paenibacillus uliginis N3/975 OX=1313296 GN=SAMN05661091_6134 PE=4 SV=1
MM1 pKa = 7.25KK2 pKa = 9.45QTFKK6 pKa = 11.13PNVSKK11 pKa = 10.88RR12 pKa = 11.84KK13 pKa = 8.93KK14 pKa = 8.63NHH16 pKa = 4.91GFRR19 pKa = 11.84KK20 pKa = 9.98RR21 pKa = 11.84MSTKK25 pKa = 10.18NGRR28 pKa = 11.84KK29 pKa = 8.7VLASRR34 pKa = 11.84RR35 pKa = 11.84QKK37 pKa = 10.15GRR39 pKa = 11.84KK40 pKa = 8.58VLSAA44 pKa = 4.05
MM1 pKa = 7.25KK2 pKa = 9.45QTFKK6 pKa = 11.13PNVSKK11 pKa = 10.88RR12 pKa = 11.84KK13 pKa = 8.93KK14 pKa = 8.63NHH16 pKa = 4.91GFRR19 pKa = 11.84KK20 pKa = 9.98RR21 pKa = 11.84MSTKK25 pKa = 10.18NGRR28 pKa = 11.84KK29 pKa = 8.7VLASRR34 pKa = 11.84RR35 pKa = 11.84QKK37 pKa = 10.15GRR39 pKa = 11.84KK40 pKa = 8.58VLSAA44 pKa = 4.05
Molecular weight: 5.17 kDa
Isoelectric point according different methods:
Peptides (in silico digests for buttom-up proteomics)
Below you can find in silico digests of the whole proteome with Trypsin, Chymotrypsin, Trypsin+LysC, LysN, ArgC proteases suitable for different mass spec machines.| Try ESI |
 |
|---|
| ChTry ESI |
|
|---|
| ArgC ESI |
|
|---|
| LysN ESI |
|
|---|
| TryLysC ESI |
|
|---|
| Try MALDI |
|
|---|
| ChTry MALDI |
|
|---|
| ArgC MALDI |
|
|---|
| LysN MALDI |
|
|---|
| TryLysC MALDI |
|
|---|
| Try LTQ |
|
|---|
| ChTry LTQ |
|
|---|
| ArgC LTQ |
|
|---|
| LysN LTQ |
|
|---|
| TryLysC LTQ |
|
|---|
| Try MSlow |
|
|---|
| ChTry MSlow |
|
|---|
| ArgC MSlow |
|
|---|
| LysN MSlow |
|
|---|
| TryLysC MSlow |
|
|---|
| Try MShigh |
|
|---|
| ChTry MShigh |
|
|---|
| ArgC MShigh |
|
|---|
| LysN MShigh |
|
|---|
| TryLysC MShigh |
|
|---|
General Statistics
Number of major isoforms |
Number of additional isoforms |
Number of all proteins |
Number of amino acids |
Min. Seq. Length |
Max. Seq. Length |
Avg. Seq. Length |
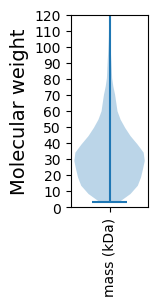
Avg. Mol. Weight |
|---|---|---|---|---|---|---|---|
0 |
1773498 |
26 |
4537 |
310.2 |
34.73 |
Amino acid frequency
Ala |
Cys |
Asp |
Glu |
Phe |
Gly |
His |
Ile |
Lys |
Leu |
|---|---|---|---|---|---|---|---|---|---|
7.301 ± 0.039 | 0.802 ± 0.01 |
5.246 ± 0.027 | 6.956 ± 0.042 |
4.207 ± 0.026 | 7.201 ± 0.033 |
2.102 ± 0.018 | 7.147 ± 0.034 |
5.808 ± 0.034 | 9.977 ± 0.035 |
Met |
Asn |
Gln |
Pro |
Arg |
Ser |
Thr |
Val |
Trp |
Tyr |
|---|---|---|---|---|---|---|---|---|---|
3.006 ± 0.017 | 4.092 ± 0.026 |
3.863 ± 0.02 | 3.818 ± 0.023 |
4.743 ± 0.029 | 6.553 ± 0.026 |
5.361 ± 0.024 | 7.01 ± 0.026 |
1.218 ± 0.012 | 3.589 ± 0.022 |
Most of the basic statistics you can see at this page can be downloaded from this CSV file
See this proteome in:

Proteome-pI is available under Creative Commons Attribution-NoDerivs license, for more details see here
| Reference: Kozlowski LP. Proteome-pI 2.0: Proteome Isoelectric Point Database Update. Nucleic Acids Res. 2021, doi: 10.1093/nar/gkab944 | Contact: Lukasz P. Kozlowski |