Microbacterium phage Knox
Taxonomy: Viruses; Duplodnaviria; Heunggongvirae; Uroviricota; Caudoviricetes; Caudovirales; Siphoviridae; Ilzatvirus; unclassified Ilzatvirus
Average proteome isoelectric point is 6.05
Get precalculated fractions of proteins
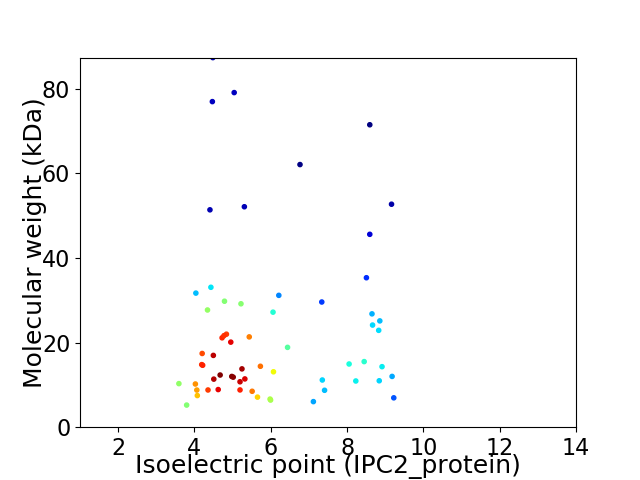
Virtual 2D-PAGE plot for 63 proteins (isoelectric point calculated using IPC2_protein)
Get csv file with sequences according to given criteria:
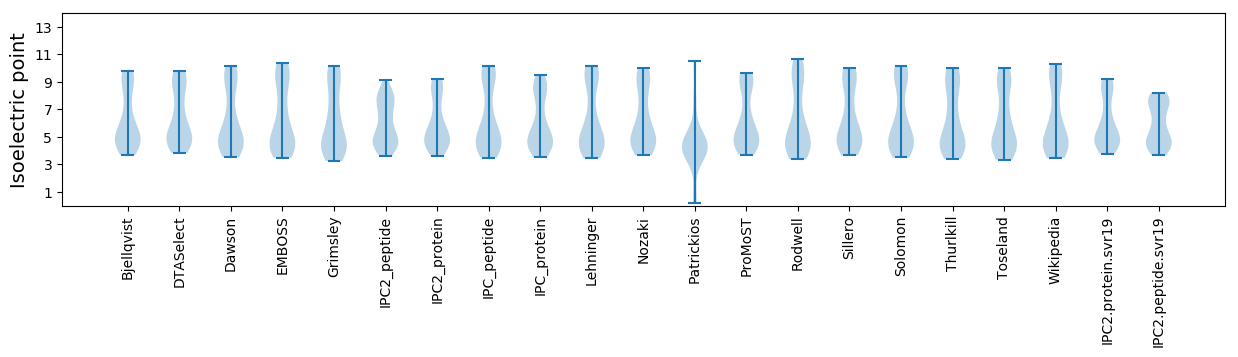
* You can choose from 21 different methods for calculating isoelectric point
Summary statistics related to proteome-wise predictions
Protein with the lowest isoelectric point:
>tr|A0A2L0HMN3|A0A2L0HMN3_9CAUD Tail assembly chaperone OS=Microbacterium phage Knox OX=2079586 GN=16 PE=4 SV=1
MM1 pKa = 7.49IQMACTDD8 pKa = 4.49CDD10 pKa = 4.26DD11 pKa = 4.15KK12 pKa = 11.46QQEE15 pKa = 4.4PFSEE19 pKa = 4.6TEE21 pKa = 3.94GEE23 pKa = 4.5GTVDD27 pKa = 3.4TQEE30 pKa = 4.49TPSEE34 pKa = 4.49VYY36 pKa = 10.59DD37 pKa = 3.71HH38 pKa = 7.36AEE40 pKa = 3.76HH41 pKa = 6.96FGPPEE46 pKa = 3.55AA47 pKa = 5.69
MM1 pKa = 7.49IQMACTDD8 pKa = 4.49CDD10 pKa = 4.26DD11 pKa = 4.15KK12 pKa = 11.46QQEE15 pKa = 4.4PFSEE19 pKa = 4.6TEE21 pKa = 3.94GEE23 pKa = 4.5GTVDD27 pKa = 3.4TQEE30 pKa = 4.49TPSEE34 pKa = 4.49VYY36 pKa = 10.59DD37 pKa = 3.71HH38 pKa = 7.36AEE40 pKa = 3.76HH41 pKa = 6.96FGPPEE46 pKa = 3.55AA47 pKa = 5.69
Molecular weight: 5.23 kDa
Isoelectric point according different methods:
Protein with the highest isoelectric point:
>tr|A0A2L0HMT3|A0A2L0HMT3_9CAUD Uncharacterized protein OS=Microbacterium phage Knox OX=2079586 GN=49 PE=4 SV=1
MM1 pKa = 7.2TVATYY6 pKa = 10.18IIARR10 pKa = 11.84TGKK13 pKa = 9.94GRR15 pKa = 11.84PTLQHH20 pKa = 6.76ALADD24 pKa = 4.25DD25 pKa = 4.41GQRR28 pKa = 11.84TVCGLDD34 pKa = 3.0VSYY37 pKa = 10.49WSRR40 pKa = 11.84AYY42 pKa = 9.87QSRR45 pKa = 11.84PITEE49 pKa = 3.92IVCRR53 pKa = 11.84KK54 pKa = 7.89CAKK57 pKa = 10.17RR58 pKa = 11.84LTGSAA63 pKa = 3.72
MM1 pKa = 7.2TVATYY6 pKa = 10.18IIARR10 pKa = 11.84TGKK13 pKa = 9.94GRR15 pKa = 11.84PTLQHH20 pKa = 6.76ALADD24 pKa = 4.25DD25 pKa = 4.41GQRR28 pKa = 11.84TVCGLDD34 pKa = 3.0VSYY37 pKa = 10.49WSRR40 pKa = 11.84AYY42 pKa = 9.87QSRR45 pKa = 11.84PITEE49 pKa = 3.92IVCRR53 pKa = 11.84KK54 pKa = 7.89CAKK57 pKa = 10.17RR58 pKa = 11.84LTGSAA63 pKa = 3.72
Molecular weight: 6.94 kDa
Isoelectric point according different methods:
Peptides (in silico digests for buttom-up proteomics)
Below you can find in silico digests of the whole proteome with Trypsin, Chymotrypsin, Trypsin+LysC, LysN, ArgC proteases suitable for different mass spec machines.| Try ESI |
 |
|---|
| ChTry ESI |
|
|---|
| ArgC ESI |
|
|---|
| LysN ESI |
|
|---|
| TryLysC ESI |
|
|---|
| Try MALDI |
|
|---|
| ChTry MALDI |
|
|---|
| ArgC MALDI |
|
|---|
| LysN MALDI |
|
|---|
| TryLysC MALDI |
|
|---|
| Try LTQ |
|
|---|
| ChTry LTQ |
|
|---|
| ArgC LTQ |
|
|---|
| LysN LTQ |
|
|---|
| TryLysC LTQ |
|
|---|
| Try MSlow |
|
|---|
| ChTry MSlow |
|
|---|
| ArgC MSlow |
|
|---|
| LysN MSlow |
|
|---|
| TryLysC MSlow |
|
|---|
| Try MShigh |
|
|---|
| ChTry MShigh |
|
|---|
| ArgC MShigh |
|
|---|
| LysN MShigh |
|
|---|
| TryLysC MShigh |
|
|---|
General Statistics
Number of major isoforms |
Number of additional isoforms |
Number of all proteins |
Number of amino acids |
Min. Seq. Length |
Max. Seq. Length |
Avg. Seq. Length |
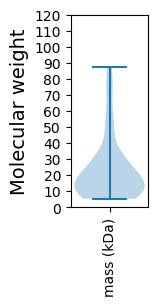
Avg. Mol. Weight |
|---|---|---|---|---|---|---|---|
0 |
13221 |
47 |
808 |
209.9 |
23.19 |
Amino acid frequency
Ala |
Cys |
Asp |
Glu |
Phe |
Gly |
His |
Ile |
Lys |
Leu |
|---|---|---|---|---|---|---|---|---|---|
9.735 ± 0.45 | 0.658 ± 0.098 |
6.429 ± 0.271 | 6.52 ± 0.45 |
3.063 ± 0.202 | 7.874 ± 0.362 |
1.876 ± 0.191 | 5.06 ± 0.393 |
4.69 ± 0.375 | 8.532 ± 0.267 |
Met |
Asn |
Gln |
Pro |
Arg |
Ser |
Thr |
Val |
Trp |
Tyr |
|---|---|---|---|---|---|---|---|---|---|
2.519 ± 0.155 | 3.207 ± 0.167 |
4.924 ± 0.235 | 4.069 ± 0.189 |
5.741 ± 0.339 | 6.021 ± 0.238 |
6.414 ± 0.294 | 7.443 ± 0.29 |
2.133 ± 0.228 | 3.094 ± 0.232 |
Most of the basic statistics you can see at this page can be downloaded from this CSV file
See this proteome in:

Proteome-pI is available under Creative Commons Attribution-NoDerivs license, for more details see here
| Reference: Kozlowski LP. Proteome-pI 2.0: Proteome Isoelectric Point Database Update. Nucleic Acids Res. 2021, doi: 10.1093/nar/gkab944 | Contact: Lukasz P. Kozlowski |