Streptococcus phage Javan436
Taxonomy: Viruses; Duplodnaviria; Heunggongvirae; Uroviricota; Caudoviricetes; Caudovirales; Siphoviridae; unclassified Siphoviridae
Average proteome isoelectric point is 6.71
Get precalculated fractions of proteins
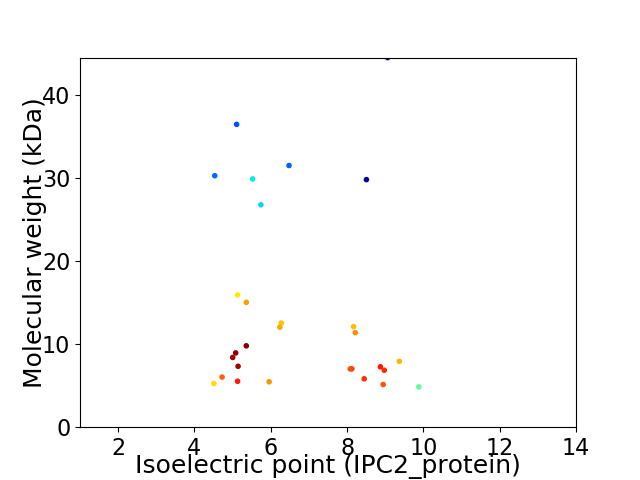
Virtual 2D-PAGE plot for 29 proteins (isoelectric point calculated using IPC2_protein)
Get csv file with sequences according to given criteria:
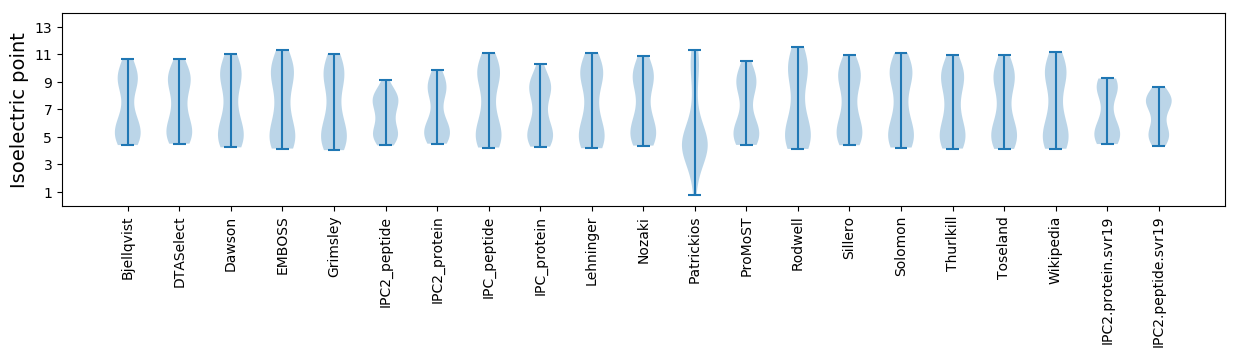
* You can choose from 21 different methods for calculating isoelectric point
Summary statistics related to proteome-wise predictions
Protein with the lowest isoelectric point:
>tr|A0A4D6B2V6|A0A4D6B2V6_9VIRU Uncharacterized protein OS=Streptococcus phage Javan436 OX=2548165 GN=Javan436_0012 PE=4 SV=1
MM1 pKa = 7.8GILEE5 pKa = 5.46LIEE8 pKa = 3.97QFEE11 pKa = 4.14IDD13 pKa = 4.75YY14 pKa = 11.2YY15 pKa = 9.94PLSYY19 pKa = 10.56EE20 pKa = 4.36KK21 pKa = 9.77KK22 pKa = 8.76TLLADD27 pKa = 3.68QPIHH31 pKa = 6.21QVVACLSEE39 pKa = 3.92MASWHH44 pKa = 5.66EE45 pKa = 4.05CGGRR49 pKa = 11.84LSWW52 pKa = 4.31
MM1 pKa = 7.8GILEE5 pKa = 5.46LIEE8 pKa = 3.97QFEE11 pKa = 4.14IDD13 pKa = 4.75YY14 pKa = 11.2YY15 pKa = 9.94PLSYY19 pKa = 10.56EE20 pKa = 4.36KK21 pKa = 9.77KK22 pKa = 8.76TLLADD27 pKa = 3.68QPIHH31 pKa = 6.21QVVACLSEE39 pKa = 3.92MASWHH44 pKa = 5.66EE45 pKa = 4.05CGGRR49 pKa = 11.84LSWW52 pKa = 4.31
Molecular weight: 6.04 kDa
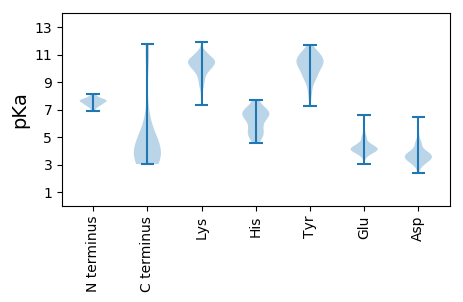
Isoelectric point according different methods:
Protein with the highest isoelectric point:
>tr|A0A4D6B481|A0A4D6B481_9VIRU Uncharacterized protein OS=Streptococcus phage Javan436 OX=2548165 GN=Javan436_0016 PE=4 SV=1
MM1 pKa = 7.66SFRR4 pKa = 11.84KK5 pKa = 9.22MKK7 pKa = 10.96AEE9 pKa = 4.04DD10 pKa = 3.42KK11 pKa = 11.05KK12 pKa = 10.53IGRR15 pKa = 11.84WKK17 pKa = 10.59YY18 pKa = 8.58RR19 pKa = 11.84LGWLVVALIWALFIWHH35 pKa = 6.96WFFF38 pKa = 5.71
MM1 pKa = 7.66SFRR4 pKa = 11.84KK5 pKa = 9.22MKK7 pKa = 10.96AEE9 pKa = 4.04DD10 pKa = 3.42KK11 pKa = 11.05KK12 pKa = 10.53IGRR15 pKa = 11.84WKK17 pKa = 10.59YY18 pKa = 8.58RR19 pKa = 11.84LGWLVVALIWALFIWHH35 pKa = 6.96WFFF38 pKa = 5.71
Molecular weight: 4.86 kDa
Isoelectric point according different methods:
Peptides (in silico digests for buttom-up proteomics)
Below you can find in silico digests of the whole proteome with Trypsin, Chymotrypsin, Trypsin+LysC, LysN, ArgC proteases suitable for different mass spec machines.| Try ESI |
 |
|---|
| ChTry ESI |
|
|---|
| ArgC ESI |
|
|---|
| LysN ESI |
|
|---|
| TryLysC ESI |
|
|---|
| Try MALDI |
|
|---|
| ChTry MALDI |
|
|---|
| ArgC MALDI |
|
|---|
| LysN MALDI |
|
|---|
| TryLysC MALDI |
|
|---|
| Try LTQ |
|
|---|
| ChTry LTQ |
|
|---|
| ArgC LTQ |
|
|---|
| LysN LTQ |
|
|---|
| TryLysC LTQ |
|
|---|
| Try MSlow |
|
|---|
| ChTry MSlow |
|
|---|
| ArgC MSlow |
|
|---|
| LysN MSlow |
|
|---|
| TryLysC MSlow |
|
|---|
| Try MShigh |
|
|---|
| ChTry MShigh |
|
|---|
| ArgC MShigh |
|
|---|
| LysN MShigh |
|
|---|
| TryLysC MShigh |
|
|---|
General Statistics
Number of major isoforms |
Number of additional isoforms |
Number of all proteins |
Number of amino acids |
Min. Seq. Length |
Max. Seq. Length |
Avg. Seq. Length |
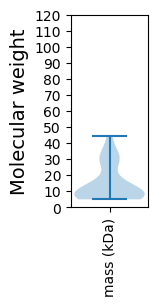
Avg. Mol. Weight |
|---|---|---|---|---|---|---|---|
0 |
3614 |
38 |
381 |
124.6 |
14.39 |
Amino acid frequency
Ala |
Cys |
Asp |
Glu |
Phe |
Gly |
His |
Ile |
Lys |
Leu |
|---|---|---|---|---|---|---|---|---|---|
6.281 ± 0.524 | 0.775 ± 0.144 |
6.143 ± 0.315 | 8.329 ± 0.536 |
4.095 ± 0.41 | 5.285 ± 0.555 |
1.799 ± 0.178 | 7.194 ± 0.568 |
9.408 ± 0.594 | 9.353 ± 0.526 |
Met |
Asn |
Gln |
Pro |
Arg |
Ser |
Thr |
Val |
Trp |
Tyr |
|---|---|---|---|---|---|---|---|---|---|
2.739 ± 0.341 | 5.23 ± 0.47 |
2.49 ± 0.353 | 3.874 ± 0.315 |
4.787 ± 0.416 | 5.285 ± 0.367 |
5.589 ± 0.404 | 5.562 ± 0.407 |
1.467 ± 0.352 | 4.317 ± 0.517 |
Most of the basic statistics you can see at this page can be downloaded from this CSV file
See this proteome in:

Proteome-pI is available under Creative Commons Attribution-NoDerivs license, for more details see here
| Reference: Kozlowski LP. Proteome-pI 2.0: Proteome Isoelectric Point Database Update. Nucleic Acids Res. 2021, doi: 10.1093/nar/gkab944 | Contact: Lukasz P. Kozlowski |