Fowl aviadenovirus B
Taxonomy: Viruses; Varidnaviria; Bamfordvirae; Preplasmiviricota; Tectiliviricetes; Rowavirales; Adenoviridae; Aviadenovirus
Average proteome isoelectric point is 6.4
Get precalculated fractions of proteins
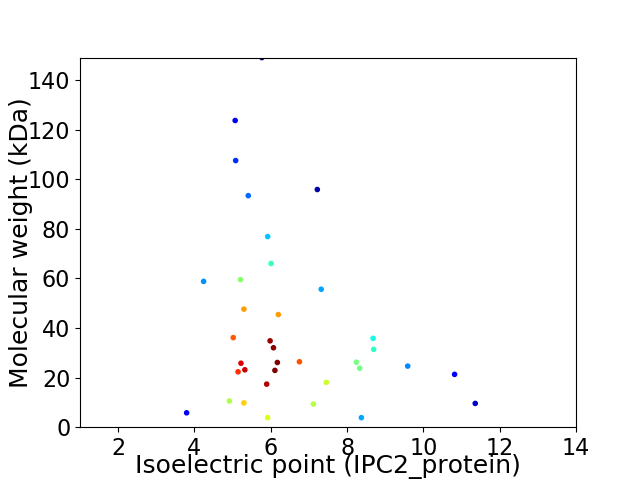
Virtual 2D-PAGE plot for 36 proteins (isoelectric point calculated using IPC2_protein)
Get csv file with sequences according to given criteria:
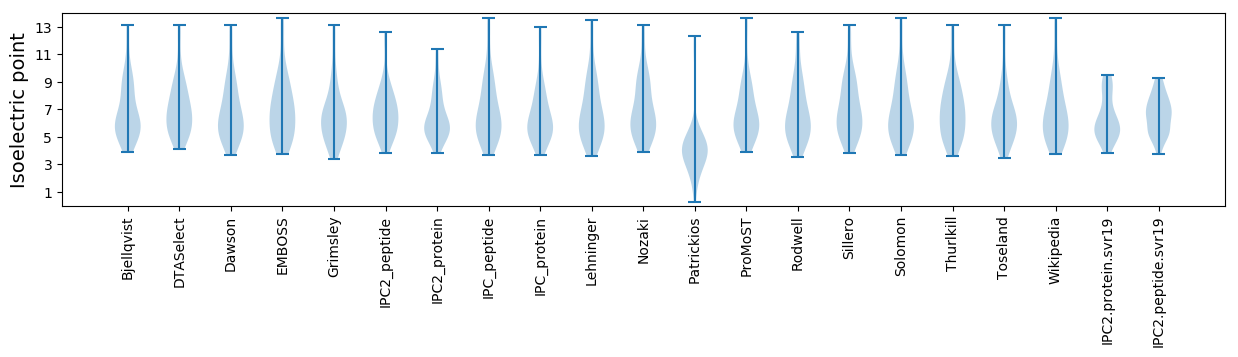
* You can choose from 21 different methods for calculating isoelectric point
Summary statistics related to proteome-wise predictions
Protein with the lowest isoelectric point:
>tr|A0A4Y5G377|A0A4Y5G377_9ADEN PVII OS=Fowl aviadenovirus B OX=190062 PE=4 SV=1
GG1 pKa = 6.54QSAVSTGDD9 pKa = 3.16EE10 pKa = 4.3FFGDD14 pKa = 3.76EE15 pKa = 3.81VDD17 pKa = 4.39FAARR21 pKa = 11.84VTATVLADD29 pKa = 3.45NDD31 pKa = 3.58ASADD35 pKa = 3.94CSCGLDD41 pKa = 3.24TGKK44 pKa = 9.95NVCSLLSCHH53 pKa = 6.71CVILL57 pKa = 4.29
GG1 pKa = 6.54QSAVSTGDD9 pKa = 3.16EE10 pKa = 4.3FFGDD14 pKa = 3.76EE15 pKa = 3.81VDD17 pKa = 4.39FAARR21 pKa = 11.84VTATVLADD29 pKa = 3.45NDD31 pKa = 3.58ASADD35 pKa = 3.94CSCGLDD41 pKa = 3.24TGKK44 pKa = 9.95NVCSLLSCHH53 pKa = 6.71CVILL57 pKa = 4.29
Molecular weight: 5.8 kDa
Isoelectric point according different methods:
Protein with the highest isoelectric point:
>tr|A0A4Y5G379|A0A4Y5G379_9ADEN ORF57 OS=Fowl aviadenovirus B OX=190062 PE=4 SV=1
MM1 pKa = 7.59SILVSPNDD9 pKa = 3.21NRR11 pKa = 11.84GWGMRR16 pKa = 11.84RR17 pKa = 11.84RR18 pKa = 11.84SRR20 pKa = 11.84SAMRR24 pKa = 11.84GVGTRR29 pKa = 11.84RR30 pKa = 11.84RR31 pKa = 11.84PRR33 pKa = 11.84RR34 pKa = 11.84SRR36 pKa = 11.84MTLRR40 pKa = 11.84TLLGLGTASRR50 pKa = 11.84RR51 pKa = 11.84RR52 pKa = 11.84RR53 pKa = 11.84GRR55 pKa = 11.84RR56 pKa = 11.84VGRR59 pKa = 11.84RR60 pKa = 11.84SRR62 pKa = 11.84PAATSSRR69 pKa = 11.84LVVVRR74 pKa = 11.84TSRR77 pKa = 11.84RR78 pKa = 11.84SRR80 pKa = 11.84RR81 pKa = 11.84RR82 pKa = 3.11
MM1 pKa = 7.59SILVSPNDD9 pKa = 3.21NRR11 pKa = 11.84GWGMRR16 pKa = 11.84RR17 pKa = 11.84RR18 pKa = 11.84SRR20 pKa = 11.84SAMRR24 pKa = 11.84GVGTRR29 pKa = 11.84RR30 pKa = 11.84RR31 pKa = 11.84PRR33 pKa = 11.84RR34 pKa = 11.84SRR36 pKa = 11.84MTLRR40 pKa = 11.84TLLGLGTASRR50 pKa = 11.84RR51 pKa = 11.84RR52 pKa = 11.84RR53 pKa = 11.84GRR55 pKa = 11.84RR56 pKa = 11.84VGRR59 pKa = 11.84RR60 pKa = 11.84SRR62 pKa = 11.84PAATSSRR69 pKa = 11.84LVVVRR74 pKa = 11.84TSRR77 pKa = 11.84RR78 pKa = 11.84SRR80 pKa = 11.84RR81 pKa = 11.84RR82 pKa = 3.11
Molecular weight: 9.59 kDa
Isoelectric point according different methods:
Peptides (in silico digests for buttom-up proteomics)
Below you can find in silico digests of the whole proteome with Trypsin, Chymotrypsin, Trypsin+LysC, LysN, ArgC proteases suitable for different mass spec machines.| Try ESI |
 |
|---|
| ChTry ESI |
|
|---|
| ArgC ESI |
|
|---|
| LysN ESI |
|
|---|
| TryLysC ESI |
|
|---|
| Try MALDI |
|
|---|
| ChTry MALDI |
|
|---|
| ArgC MALDI |
|
|---|
| LysN MALDI |
|
|---|
| TryLysC MALDI |
|
|---|
| Try LTQ |
|
|---|
| ChTry LTQ |
|
|---|
| ArgC LTQ |
|
|---|
| LysN LTQ |
|
|---|
| TryLysC LTQ |
|
|---|
| Try MSlow |
|
|---|
| ChTry MSlow |
|
|---|
| ArgC MSlow |
|
|---|
| LysN MSlow |
|
|---|
| TryLysC MSlow |
|
|---|
| Try MShigh |
|
|---|
| ChTry MShigh |
|
|---|
| ArgC MShigh |
|
|---|
| LysN MShigh |
|
|---|
| TryLysC MShigh |
|
|---|
General Statistics
Number of major isoforms |
Number of additional isoforms |
Number of all proteins |
Number of amino acids |
Min. Seq. Length |
Max. Seq. Length |
Avg. Seq. Length |
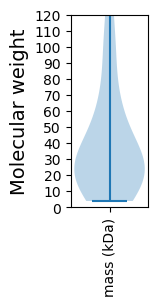
Avg. Mol. Weight |
|---|---|---|---|---|---|---|---|
13173 |
33 |
1297 |
365.9 |
41.11 |
Amino acid frequency
Ala |
Cys |
Asp |
Glu |
Phe |
Gly |
His |
Ile |
Lys |
Leu |
|---|---|---|---|---|---|---|---|---|---|
7.88 ± 0.385 | 1.928 ± 0.25 |
5.853 ± 0.225 | 6.065 ± 0.524 |
4.001 ± 0.216 | 6.566 ± 0.361 |
2.346 ± 0.18 | 3.917 ± 0.206 |
3.621 ± 0.316 | 8.768 ± 0.414 |
Met |
Asn |
Gln |
Pro |
Arg |
Ser |
Thr |
Val |
Trp |
Tyr |
|---|---|---|---|---|---|---|---|---|---|
2.308 ± 0.177 | 4.061 ± 0.436 |
6.604 ± 0.293 | 3.575 ± 0.205 |
7.576 ± 0.585 | 7.098 ± 0.405 |
5.982 ± 0.394 | 6.399 ± 0.279 |
1.45 ± 0.13 | 4.001 ± 0.31 |
Most of the basic statistics you can see at this page can be downloaded from this CSV file
See this proteome in:

Proteome-pI is available under Creative Commons Attribution-NoDerivs license, for more details see here
| Reference: Kozlowski LP. Proteome-pI 2.0: Proteome Isoelectric Point Database Update. Nucleic Acids Res. 2021, doi: 10.1093/nar/gkab944 | Contact: Lukasz P. Kozlowski |