Staphylococcus virus 37
Taxonomy: Viruses; Duplodnaviria; Heunggongvirae; Uroviricota; Caudoviricetes; Caudovirales; Siphoviridae; Azeredovirinae; Phietavirus
Average proteome isoelectric point is 6.41
Get precalculated fractions of proteins
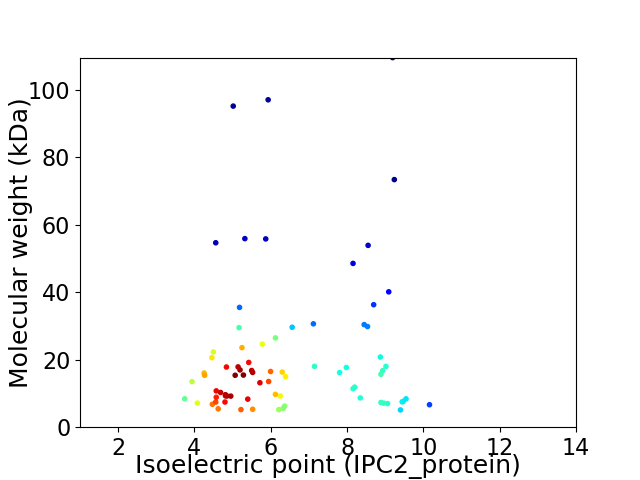
Virtual 2D-PAGE plot for 77 proteins (isoelectric point calculated using IPC2_protein)
Get csv file with sequences according to given criteria:
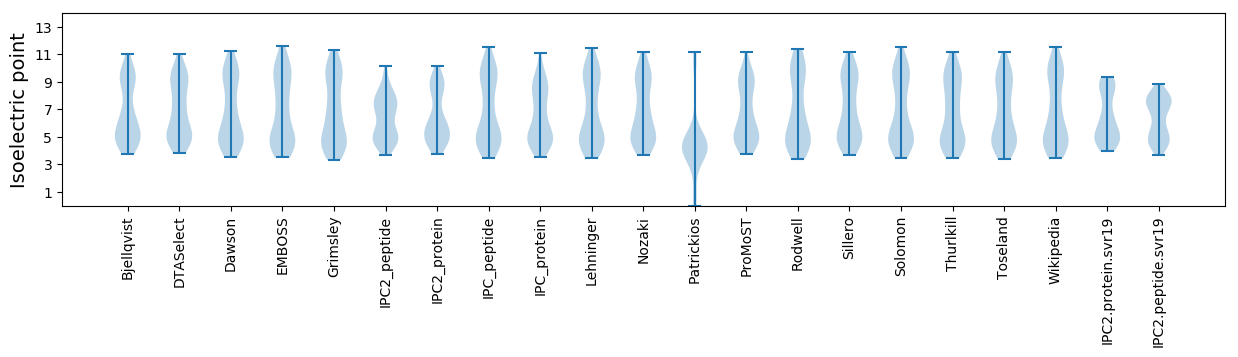
* You can choose from 21 different methods for calculating isoelectric point
Summary statistics related to proteome-wise predictions
Protein with the lowest isoelectric point:
>tr|Q4ZCA5|Q4ZCA5_9CAUD ORF092 OS=Staphylococcus virus 37 OX=320840 PE=4 SV=1
MM1 pKa = 7.45KK2 pKa = 10.55SFWLTYY8 pKa = 8.84LFCFASTSVLTLITQDD24 pKa = 4.58FIISAAWSLLLSLAVYY40 pKa = 10.17LFFLVWYY47 pKa = 9.02YY48 pKa = 11.02EE49 pKa = 3.93EE50 pKa = 6.14DD51 pKa = 3.58EE52 pKa = 4.44TEE54 pKa = 4.0EE55 pKa = 4.12AVDD58 pKa = 5.01DD59 pKa = 4.27GEE61 pKa = 4.55EE62 pKa = 4.37YY63 pKa = 9.34ITLFTIKK70 pKa = 10.45YY71 pKa = 8.89
MM1 pKa = 7.45KK2 pKa = 10.55SFWLTYY8 pKa = 8.84LFCFASTSVLTLITQDD24 pKa = 4.58FIISAAWSLLLSLAVYY40 pKa = 10.17LFFLVWYY47 pKa = 9.02YY48 pKa = 11.02EE49 pKa = 3.93EE50 pKa = 6.14DD51 pKa = 3.58EE52 pKa = 4.44TEE54 pKa = 4.0EE55 pKa = 4.12AVDD58 pKa = 5.01DD59 pKa = 4.27GEE61 pKa = 4.55EE62 pKa = 4.37YY63 pKa = 9.34ITLFTIKK70 pKa = 10.45YY71 pKa = 8.89
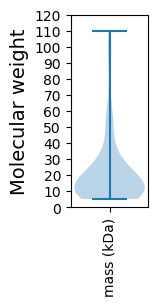
Molecular weight: 8.42 kDa
Isoelectric point according different methods:
Protein with the highest isoelectric point:
>tr|Q4ZCC3|Q4ZCC3_9CAUD ORF006 OS=Staphylococcus virus 37 OX=320840 PE=4 SV=1
MM1 pKa = 7.31KK2 pKa = 10.03HH3 pKa = 5.45YY4 pKa = 10.68FCIITPATRR13 pKa = 11.84LKK15 pKa = 10.17VISMWATCEE24 pKa = 4.06RR25 pKa = 11.84TDD27 pKa = 3.51SSYY30 pKa = 11.27HH31 pKa = 5.3NRR33 pKa = 11.84LITVRR38 pKa = 11.84KK39 pKa = 8.22PRR41 pKa = 11.84LFFHH45 pKa = 6.69IVSTITIASPRR56 pKa = 11.84SCDD59 pKa = 3.02RR60 pKa = 11.84FCRR63 pKa = 11.84VAA65 pKa = 4.32
MM1 pKa = 7.31KK2 pKa = 10.03HH3 pKa = 5.45YY4 pKa = 10.68FCIITPATRR13 pKa = 11.84LKK15 pKa = 10.17VISMWATCEE24 pKa = 4.06RR25 pKa = 11.84TDD27 pKa = 3.51SSYY30 pKa = 11.27HH31 pKa = 5.3NRR33 pKa = 11.84LITVRR38 pKa = 11.84KK39 pKa = 8.22PRR41 pKa = 11.84LFFHH45 pKa = 6.69IVSTITIASPRR56 pKa = 11.84SCDD59 pKa = 3.02RR60 pKa = 11.84FCRR63 pKa = 11.84VAA65 pKa = 4.32
Molecular weight: 7.65 kDa
Isoelectric point according different methods:
Peptides (in silico digests for buttom-up proteomics)
Below you can find in silico digests of the whole proteome with Trypsin, Chymotrypsin, Trypsin+LysC, LysN, ArgC proteases suitable for different mass spec machines.| Try ESI |
 |
|---|
| ChTry ESI |
|
|---|
| ArgC ESI |
|
|---|
| LysN ESI |
|
|---|
| TryLysC ESI |
|
|---|
| Try MALDI |
|
|---|
| ChTry MALDI |
|
|---|
| ArgC MALDI |
|
|---|
| LysN MALDI |
|
|---|
| TryLysC MALDI |
|
|---|
| Try LTQ |
|
|---|
| ChTry LTQ |
|
|---|
| ArgC LTQ |
|
|---|
| LysN LTQ |
|
|---|
| TryLysC LTQ |
|
|---|
| Try MSlow |
|
|---|
| ChTry MSlow |
|
|---|
| ArgC MSlow |
|
|---|
| LysN MSlow |
|
|---|
| TryLysC MSlow |
|
|---|
| Try MShigh |
|
|---|
| ChTry MShigh |
|
|---|
| ArgC MShigh |
|
|---|
| LysN MShigh |
|
|---|
| TryLysC MShigh |
|
|---|
General Statistics
Number of major isoforms |
Number of additional isoforms |
Number of all proteins |
Number of amino acids |
Min. Seq. Length |
Max. Seq. Length |
Avg. Seq. Length |
Avg. Mol. Weight |
|---|---|---|---|---|---|---|---|
0 |
14468 |
40 |
1001 |
187.9 |
21.5 |
Amino acid frequency
Ala |
Cys |
Asp |
Glu |
Phe |
Gly |
His |
Ile |
Lys |
Leu |
|---|---|---|---|---|---|---|---|---|---|
5.543 ± 0.348 | 0.677 ± 0.114 |
6.082 ± 0.298 | 6.988 ± 0.414 |
4.451 ± 0.282 | 6.158 ± 0.386 |
1.88 ± 0.156 | 7.451 ± 0.294 |
8.343 ± 0.308 | 7.61 ± 0.312 |
Met |
Asn |
Gln |
Pro |
Arg |
Ser |
Thr |
Val |
Trp |
Tyr |
|---|---|---|---|---|---|---|---|---|---|
2.447 ± 0.168 | 6.704 ± 0.384 |
2.979 ± 0.164 | 4.361 ± 0.227 |
4.154 ± 0.252 | 5.868 ± 0.278 |
6.124 ± 0.189 | 6.262 ± 0.215 |
1.237 ± 0.165 | 4.679 ± 0.31 |
Most of the basic statistics you can see at this page can be downloaded from this CSV file
See this proteome in:

Proteome-pI is available under Creative Commons Attribution-NoDerivs license, for more details see here
| Reference: Kozlowski LP. Proteome-pI 2.0: Proteome Isoelectric Point Database Update. Nucleic Acids Res. 2021, doi: 10.1093/nar/gkab944 | Contact: Lukasz P. Kozlowski |