Jeotgalibaca dankookensis
Taxonomy: cellular organisms; Bacteria; Terrabacteria group; Firmicutes; Bacilli; Lactobacillales; Carnobacteriaceae; Jeotgalibaca
Average proteome isoelectric point is 6.08
Get precalculated fractions of proteins
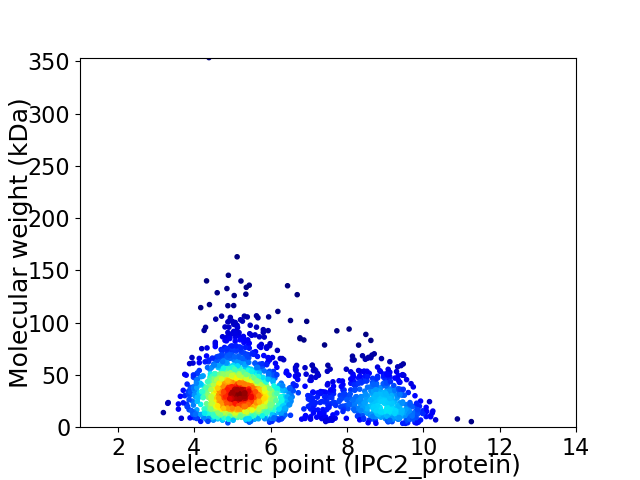
Virtual 2D-PAGE plot for 2003 proteins (isoelectric point calculated using IPC2_protein)
Get csv file with sequences according to given criteria:
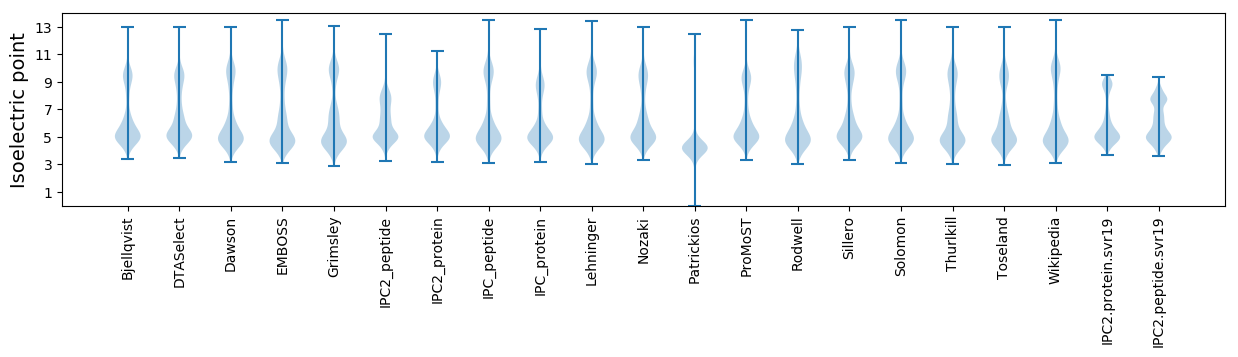
* You can choose from 21 different methods for calculating isoelectric point
Summary statistics related to proteome-wise predictions
Protein with the lowest isoelectric point:
>tr|A0A1S6INU5|A0A1S6INU5_9LACT Elp3 domain-containing protein OS=Jeotgalibaca dankookensis OX=708126 GN=BW727_100818 PE=4 SV=1
MM1 pKa = 7.52KK2 pKa = 9.19KK3 pKa = 8.39TVAILSSVFLLAACQDD19 pKa = 3.83TTDD22 pKa = 3.48ATQEE26 pKa = 4.18SVVNEE31 pKa = 4.16EE32 pKa = 3.98SGQTQVSTVEE42 pKa = 4.35SVEE45 pKa = 4.21SEE47 pKa = 4.14AVSSEE52 pKa = 3.97VQEE55 pKa = 4.36DD56 pKa = 3.67VAYY59 pKa = 9.76EE60 pKa = 3.94YY61 pKa = 10.6EE62 pKa = 4.41INPDD66 pKa = 3.7LYY68 pKa = 10.46TVVPIDD74 pKa = 4.05DD75 pKa = 4.77ADD77 pKa = 4.1TEE79 pKa = 4.76VVLLTFDD86 pKa = 5.9DD87 pKa = 5.19APQPPNSYY95 pKa = 8.39TLDD98 pKa = 3.31IAQTVQDD105 pKa = 4.23KK106 pKa = 10.31GANAIFFVMGQFLEE120 pKa = 4.31EE121 pKa = 4.37PEE123 pKa = 3.98AKK125 pKa = 10.26EE126 pKa = 4.07IIKK129 pKa = 8.96TVYY132 pKa = 11.21DD133 pKa = 3.33MGFEE137 pKa = 4.26IGNHH141 pKa = 5.87SYY143 pKa = 10.76SHH145 pKa = 7.61PDD147 pKa = 3.22LTTLTYY153 pKa = 10.56EE154 pKa = 4.09EE155 pKa = 4.18QLAEE159 pKa = 3.91ITKK162 pKa = 9.97TSDD165 pKa = 2.99LVEE168 pKa = 4.96EE169 pKa = 4.48ITGEE173 pKa = 3.8RR174 pKa = 11.84PRR176 pKa = 11.84FIRR179 pKa = 11.84APYY182 pKa = 9.99GSYY185 pKa = 10.77NSEE188 pKa = 3.9TEE190 pKa = 4.38AIADD194 pKa = 4.07GEE196 pKa = 4.44NMTIMNWTYY205 pKa = 10.84GYY207 pKa = 10.82DD208 pKa = 3.22WVDD211 pKa = 3.34GYY213 pKa = 10.19MEE215 pKa = 4.79EE216 pKa = 5.3DD217 pKa = 4.19AIADD221 pKa = 3.4IMINAPEE228 pKa = 4.72LGSGGNLLMHH238 pKa = 6.89DD239 pKa = 4.28RR240 pKa = 11.84QWTSAAISRR249 pKa = 11.84IIDD252 pKa = 3.46GLRR255 pKa = 11.84DD256 pKa = 3.22AGYY259 pKa = 11.24EE260 pKa = 4.12MVDD263 pKa = 3.4PTLIASPEE271 pKa = 3.98EE272 pKa = 4.01AA273 pKa = 4.22
MM1 pKa = 7.52KK2 pKa = 9.19KK3 pKa = 8.39TVAILSSVFLLAACQDD19 pKa = 3.83TTDD22 pKa = 3.48ATQEE26 pKa = 4.18SVVNEE31 pKa = 4.16EE32 pKa = 3.98SGQTQVSTVEE42 pKa = 4.35SVEE45 pKa = 4.21SEE47 pKa = 4.14AVSSEE52 pKa = 3.97VQEE55 pKa = 4.36DD56 pKa = 3.67VAYY59 pKa = 9.76EE60 pKa = 3.94YY61 pKa = 10.6EE62 pKa = 4.41INPDD66 pKa = 3.7LYY68 pKa = 10.46TVVPIDD74 pKa = 4.05DD75 pKa = 4.77ADD77 pKa = 4.1TEE79 pKa = 4.76VVLLTFDD86 pKa = 5.9DD87 pKa = 5.19APQPPNSYY95 pKa = 8.39TLDD98 pKa = 3.31IAQTVQDD105 pKa = 4.23KK106 pKa = 10.31GANAIFFVMGQFLEE120 pKa = 4.31EE121 pKa = 4.37PEE123 pKa = 3.98AKK125 pKa = 10.26EE126 pKa = 4.07IIKK129 pKa = 8.96TVYY132 pKa = 11.21DD133 pKa = 3.33MGFEE137 pKa = 4.26IGNHH141 pKa = 5.87SYY143 pKa = 10.76SHH145 pKa = 7.61PDD147 pKa = 3.22LTTLTYY153 pKa = 10.56EE154 pKa = 4.09EE155 pKa = 4.18QLAEE159 pKa = 3.91ITKK162 pKa = 9.97TSDD165 pKa = 2.99LVEE168 pKa = 4.96EE169 pKa = 4.48ITGEE173 pKa = 3.8RR174 pKa = 11.84PRR176 pKa = 11.84FIRR179 pKa = 11.84APYY182 pKa = 9.99GSYY185 pKa = 10.77NSEE188 pKa = 3.9TEE190 pKa = 4.38AIADD194 pKa = 4.07GEE196 pKa = 4.44NMTIMNWTYY205 pKa = 10.84GYY207 pKa = 10.82DD208 pKa = 3.22WVDD211 pKa = 3.34GYY213 pKa = 10.19MEE215 pKa = 4.79EE216 pKa = 5.3DD217 pKa = 4.19AIADD221 pKa = 3.4IMINAPEE228 pKa = 4.72LGSGGNLLMHH238 pKa = 6.89DD239 pKa = 4.28RR240 pKa = 11.84QWTSAAISRR249 pKa = 11.84IIDD252 pKa = 3.46GLRR255 pKa = 11.84DD256 pKa = 3.22AGYY259 pKa = 11.24EE260 pKa = 4.12MVDD263 pKa = 3.4PTLIASPEE271 pKa = 3.98EE272 pKa = 4.01AA273 pKa = 4.22
Molecular weight: 30.21 kDa
Isoelectric point according different methods:
Protein with the highest isoelectric point:
>tr|A0A1S6IRL2|A0A1S6IRL2_9LACT Flagellar basal body rod protein FlgB OS=Jeotgalibaca dankookensis OX=708126 GN=flgB PE=3 SV=1
MM1 pKa = 7.45KK2 pKa = 9.6RR3 pKa = 11.84TFQPKK8 pKa = 8.11KK9 pKa = 8.92RR10 pKa = 11.84KK11 pKa = 7.58RR12 pKa = 11.84QRR14 pKa = 11.84VHH16 pKa = 6.34GFRR19 pKa = 11.84KK20 pKa = 10.04RR21 pKa = 11.84MSTKK25 pKa = 10.02NGRR28 pKa = 11.84NVLASRR34 pKa = 11.84RR35 pKa = 11.84RR36 pKa = 11.84KK37 pKa = 8.73GRR39 pKa = 11.84KK40 pKa = 8.76VLSAA44 pKa = 4.05
MM1 pKa = 7.45KK2 pKa = 9.6RR3 pKa = 11.84TFQPKK8 pKa = 8.11KK9 pKa = 8.92RR10 pKa = 11.84KK11 pKa = 7.58RR12 pKa = 11.84QRR14 pKa = 11.84VHH16 pKa = 6.34GFRR19 pKa = 11.84KK20 pKa = 10.04RR21 pKa = 11.84MSTKK25 pKa = 10.02NGRR28 pKa = 11.84NVLASRR34 pKa = 11.84RR35 pKa = 11.84RR36 pKa = 11.84KK37 pKa = 8.73GRR39 pKa = 11.84KK40 pKa = 8.76VLSAA44 pKa = 4.05
Molecular weight: 5.34 kDa
Isoelectric point according different methods:
Peptides (in silico digests for buttom-up proteomics)
Below you can find in silico digests of the whole proteome with Trypsin, Chymotrypsin, Trypsin+LysC, LysN, ArgC proteases suitable for different mass spec machines.| Try ESI |
 |
|---|
| ChTry ESI |
|
|---|
| ArgC ESI |
|
|---|
| LysN ESI |
|
|---|
| TryLysC ESI |
|
|---|
| Try MALDI |
|
|---|
| ChTry MALDI |
|
|---|
| ArgC MALDI |
|
|---|
| LysN MALDI |
|
|---|
| TryLysC MALDI |
|
|---|
| Try LTQ |
|
|---|
| ChTry LTQ |
|
|---|
| ArgC LTQ |
|
|---|
| LysN LTQ |
|
|---|
| TryLysC LTQ |
|
|---|
| Try MSlow |
|
|---|
| ChTry MSlow |
|
|---|
| ArgC MSlow |
|
|---|
| LysN MSlow |
|
|---|
| TryLysC MSlow |
|
|---|
| Try MShigh |
|
|---|
| ChTry MShigh |
|
|---|
| ArgC MShigh |
|
|---|
| LysN MShigh |
|
|---|
| TryLysC MShigh |
|
|---|
General Statistics
Number of major isoforms |
Number of additional isoforms |
Number of all proteins |
Number of amino acids |
Min. Seq. Length |
Max. Seq. Length |
Avg. Seq. Length |
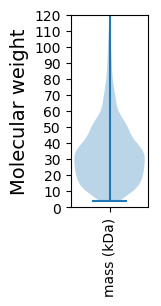
Avg. Mol. Weight |
|---|---|---|---|---|---|---|---|
0 |
623611 |
29 |
3192 |
311.3 |
34.99 |
Amino acid frequency
Ala |
Cys |
Asp |
Glu |
Phe |
Gly |
His |
Ile |
Lys |
Leu |
|---|---|---|---|---|---|---|---|---|---|
6.965 ± 0.058 | 0.49 ± 0.016 |
5.471 ± 0.045 | 7.623 ± 0.059 |
4.461 ± 0.045 | 6.564 ± 0.048 |
1.818 ± 0.026 | 8.082 ± 0.058 |
6.586 ± 0.043 | 9.795 ± 0.055 |
Met |
Asn |
Gln |
Pro |
Arg |
Ser |
Thr |
Val |
Trp |
Tyr |
|---|---|---|---|---|---|---|---|---|---|
2.766 ± 0.027 | 4.742 ± 0.038 |
3.429 ± 0.026 | 3.92 ± 0.034 |
4.037 ± 0.038 | 6.077 ± 0.04 |
5.766 ± 0.035 | 6.844 ± 0.04 |
0.834 ± 0.018 | 3.73 ± 0.035 |
Most of the basic statistics you can see at this page can be downloaded from this CSV file
See this proteome in:

Proteome-pI is available under Creative Commons Attribution-NoDerivs license, for more details see here
| Reference: Kozlowski LP. Proteome-pI 2.0: Proteome Isoelectric Point Database Update. Nucleic Acids Res. 2021, doi: 10.1093/nar/gkab944 | Contact: Lukasz P. Kozlowski |