Brettanomyces bruxellensis AWRI1499
Taxonomy: cellular organisms; Eukaryota; Opisthokonta; Fungi; Dikarya; Ascomycota; saccharomyceta; Saccharomycotina; Saccharomycetes; Saccharomycetales; Pichiaceae; Brettanomyces; Brettanomyces bruxellensis
Average proteome isoelectric point is 6.55
Get precalculated fractions of proteins
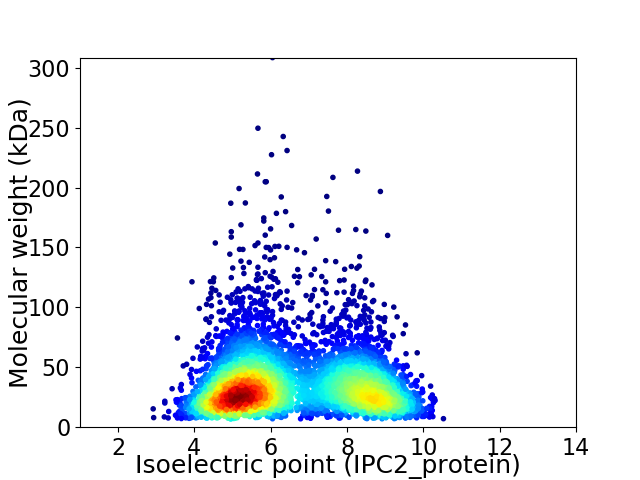
Virtual 2D-PAGE plot for 4857 proteins (isoelectric point calculated using IPC2_protein)
Get csv file with sequences according to given criteria:
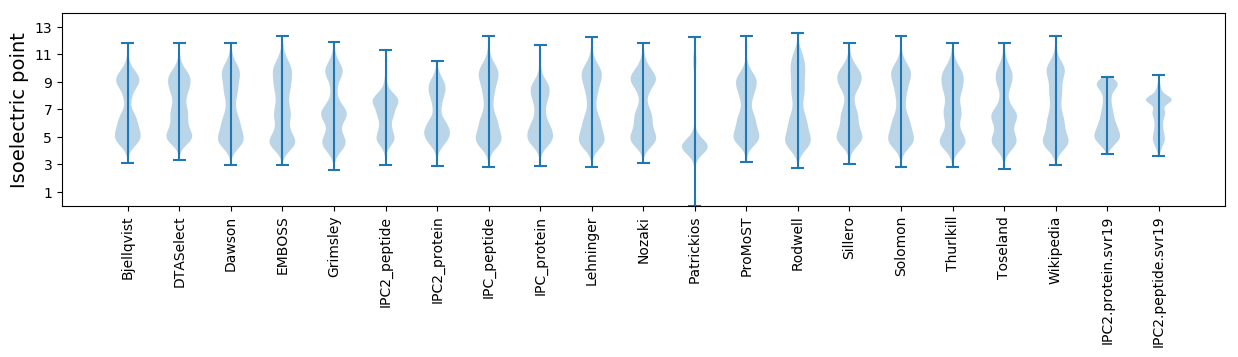
* You can choose from 21 different methods for calculating isoelectric point
Summary statistics related to proteome-wise predictions
Protein with the lowest isoelectric point:
>tr|I2JTY5|I2JTY5_DEKBR Basic leucine zipper transcription factor of the atf creb activates transcription of OS=Brettanomyces bruxellensis AWRI1499 OX=1124627 GN=AWRI1499_3678 PE=4 SV=2
MM1 pKa = 7.8RR2 pKa = 11.84FGALSLAALAGVALADD18 pKa = 3.7LDD20 pKa = 3.89ARR22 pKa = 11.84QVEE25 pKa = 4.48SLEE28 pKa = 3.99VLFLDD33 pKa = 5.11IEE35 pKa = 4.75DD36 pKa = 4.95NINGYY41 pKa = 8.12IQYY44 pKa = 11.35LMLNPGVSFPDD55 pKa = 3.53GLIALFTQIATYY67 pKa = 10.29TDD69 pKa = 4.14DD70 pKa = 3.64SFSTLFVTMSEE81 pKa = 4.22SEE83 pKa = 3.97YY84 pKa = 11.44DD85 pKa = 3.78EE86 pKa = 4.44IQSLEE91 pKa = 4.23TALPWYY97 pKa = 7.39STRR100 pKa = 11.84ILPKK104 pKa = 8.68ITIEE108 pKa = 4.31VTSSTSSTSTPVTSSSSTTVPTTVKK133 pKa = 9.67STTSTSATTSSTSTTTTSTTTTPSSTSSTTTPSTTSSTSSNPSTTTTPSTTSSTTSSTSSSEE195 pKa = 4.07STTSSVASSTSSSEE209 pKa = 3.98STTEE213 pKa = 3.66ATTSSSSSSSEE224 pKa = 3.59ATTEE228 pKa = 3.94ATTSLSTSSSEE239 pKa = 4.0SSSALEE245 pKa = 3.93TSAVSSSATSSDD257 pKa = 3.06AVTSADD263 pKa = 3.38SSLSSTLYY271 pKa = 8.75FTSAANSSAAAVTSVASSSTDD292 pKa = 3.29LAATXPVNASSSYY305 pKa = 10.61SDD307 pKa = 2.98SXLFSNSTSISATSXAXTAAASGSADD333 pKa = 3.3VVTTIVTITSCSDD346 pKa = 3.3HH347 pKa = 6.83VCTKK351 pKa = 9.8TAVTTGVKK359 pKa = 10.42SFTTTEE365 pKa = 4.08NGTKK369 pKa = 10.03TILTTYY375 pKa = 9.89CPLSSVSKK383 pKa = 9.51TSAIQATYY391 pKa = 10.87SNTPATEE398 pKa = 3.76TTAAVPXXSTSXSSEE413 pKa = 3.87STASEE418 pKa = 3.89AAXVSTYY425 pKa = 10.66EE426 pKa = 3.77GXAVKK431 pKa = 10.48FGYY434 pKa = 10.1SSNLMAAAAALLLLL448 pKa = 4.61
MM1 pKa = 7.8RR2 pKa = 11.84FGALSLAALAGVALADD18 pKa = 3.7LDD20 pKa = 3.89ARR22 pKa = 11.84QVEE25 pKa = 4.48SLEE28 pKa = 3.99VLFLDD33 pKa = 5.11IEE35 pKa = 4.75DD36 pKa = 4.95NINGYY41 pKa = 8.12IQYY44 pKa = 11.35LMLNPGVSFPDD55 pKa = 3.53GLIALFTQIATYY67 pKa = 10.29TDD69 pKa = 4.14DD70 pKa = 3.64SFSTLFVTMSEE81 pKa = 4.22SEE83 pKa = 3.97YY84 pKa = 11.44DD85 pKa = 3.78EE86 pKa = 4.44IQSLEE91 pKa = 4.23TALPWYY97 pKa = 7.39STRR100 pKa = 11.84ILPKK104 pKa = 8.68ITIEE108 pKa = 4.31VTSSTSSTSTPVTSSSSTTVPTTVKK133 pKa = 9.67STTSTSATTSSTSTTTTSTTTTPSSTSSTTTPSTTSSTSSNPSTTTTPSTTSSTTSSTSSSEE195 pKa = 4.07STTSSVASSTSSSEE209 pKa = 3.98STTEE213 pKa = 3.66ATTSSSSSSSEE224 pKa = 3.59ATTEE228 pKa = 3.94ATTSLSTSSSEE239 pKa = 4.0SSSALEE245 pKa = 3.93TSAVSSSATSSDD257 pKa = 3.06AVTSADD263 pKa = 3.38SSLSSTLYY271 pKa = 8.75FTSAANSSAAAVTSVASSSTDD292 pKa = 3.29LAATXPVNASSSYY305 pKa = 10.61SDD307 pKa = 2.98SXLFSNSTSISATSXAXTAAASGSADD333 pKa = 3.3VVTTIVTITSCSDD346 pKa = 3.3HH347 pKa = 6.83VCTKK351 pKa = 9.8TAVTTGVKK359 pKa = 10.42SFTTTEE365 pKa = 4.08NGTKK369 pKa = 10.03TILTTYY375 pKa = 9.89CPLSSVSKK383 pKa = 9.51TSAIQATYY391 pKa = 10.87SNTPATEE398 pKa = 3.76TTAAVPXXSTSXSSEE413 pKa = 3.87STASEE418 pKa = 3.89AAXVSTYY425 pKa = 10.66EE426 pKa = 3.77GXAVKK431 pKa = 10.48FGYY434 pKa = 10.1SSNLMAAAAALLLLL448 pKa = 4.61
Molecular weight: 44.04 kDa
Isoelectric point according different methods:
Protein with the highest isoelectric point:
>tr|I2JWI0|I2JWI0_DEKBR Cbc2p OS=Brettanomyces bruxellensis AWRI1499 OX=1124627 GN=AWRI1499_2782 PE=3 SV=2
MM1 pKa = 6.82XCSXLXIQLAXLPLTRR17 pKa = 11.84SYY19 pKa = 12.0ANGPLKK25 pKa = 10.31ILSALPQRR33 pKa = 11.84PLKK36 pKa = 10.17KK37 pKa = 9.89IRR39 pKa = 11.84IGKK42 pKa = 8.89ARR44 pKa = 11.84PAIYY48 pKa = 10.55YY49 pKa = 9.71KK50 pKa = 10.75FNTFIEE56 pKa = 4.49LSDD59 pKa = 3.53GSVIRR64 pKa = 11.84RR65 pKa = 11.84RR66 pKa = 11.84SQYY69 pKa = 9.53PRR71 pKa = 11.84EE72 pKa = 4.27EE73 pKa = 3.89LRR75 pKa = 11.84MITDD79 pKa = 3.28QRR81 pKa = 11.84NNPLWNPSKK90 pKa = 10.8AGCC93 pKa = 4.18
MM1 pKa = 6.82XCSXLXIQLAXLPLTRR17 pKa = 11.84SYY19 pKa = 12.0ANGPLKK25 pKa = 10.31ILSALPQRR33 pKa = 11.84PLKK36 pKa = 10.17KK37 pKa = 9.89IRR39 pKa = 11.84IGKK42 pKa = 8.89ARR44 pKa = 11.84PAIYY48 pKa = 10.55YY49 pKa = 9.71KK50 pKa = 10.75FNTFIEE56 pKa = 4.49LSDD59 pKa = 3.53GSVIRR64 pKa = 11.84RR65 pKa = 11.84RR66 pKa = 11.84SQYY69 pKa = 9.53PRR71 pKa = 11.84EE72 pKa = 4.27EE73 pKa = 3.89LRR75 pKa = 11.84MITDD79 pKa = 3.28QRR81 pKa = 11.84NNPLWNPSKK90 pKa = 10.8AGCC93 pKa = 4.18
Molecular weight: 10.25 kDa
Isoelectric point according different methods:
Peptides (in silico digests for buttom-up proteomics)
Below you can find in silico digests of the whole proteome with Trypsin, Chymotrypsin, Trypsin+LysC, LysN, ArgC proteases suitable for different mass spec machines.| Try ESI |
 |
|---|
| ChTry ESI |
|
|---|
| ArgC ESI |
|
|---|
| LysN ESI |
|
|---|
| TryLysC ESI |
|
|---|
| Try MALDI |
|
|---|
| ChTry MALDI |
|
|---|
| ArgC MALDI |
|
|---|
| LysN MALDI |
|
|---|
| TryLysC MALDI |
|
|---|
| Try LTQ |
|
|---|
| ChTry LTQ |
|
|---|
| ArgC LTQ |
|
|---|
| LysN LTQ |
|
|---|
| TryLysC LTQ |
|
|---|
| Try MSlow |
|
|---|
| ChTry MSlow |
|
|---|
| ArgC MSlow |
|
|---|
| LysN MSlow |
|
|---|
| TryLysC MSlow |
|
|---|
| Try MShigh |
|
|---|
| ChTry MShigh |
|
|---|
| ArgC MShigh |
|
|---|
| LysN MShigh |
|
|---|
| TryLysC MShigh |
|
|---|
General Statistics
Number of major isoforms |
Number of additional isoforms |
Number of all proteins |
Number of amino acids |
Min. Seq. Length |
Max. Seq. Length |
Avg. Seq. Length |
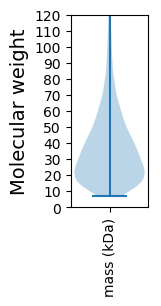
Avg. Mol. Weight |
|---|---|---|---|---|---|---|---|
0 |
1731709 |
62 |
2760 |
356.5 |
39.45 |
Amino acid frequency
Ala |
Cys |
Asp |
Glu |
Phe |
Gly |
His |
Ile |
Lys |
Leu |
|---|---|---|---|---|---|---|---|---|---|
6.182 ± 0.037 | 1.279 ± 0.013 |
6.173 ± 0.027 | 6.622 ± 0.041 |
4.155 ± 0.027 | 5.761 ± 0.032 |
1.995 ± 0.015 | 5.889 ± 0.026 |
7.233 ± 0.039 | 8.911 ± 0.036 |
Met |
Asn |
Gln |
Pro |
Arg |
Ser |
Thr |
Val |
Trp |
Tyr |
|---|---|---|---|---|---|---|---|---|---|
2.264 ± 0.015 | 4.934 ± 0.025 |
4.154 ± 0.025 | 3.767 ± 0.029 |
4.88 ± 0.029 | 8.715 ± 0.052 |
5.3 ± 0.029 | 5.822 ± 0.026 |
0.999 ± 0.012 | 3.322 ± 0.022 |
Most of the basic statistics you can see at this page can be downloaded from this CSV file
See this proteome in:

Proteome-pI is available under Creative Commons Attribution-NoDerivs license, for more details see here
| Reference: Kozlowski LP. Proteome-pI 2.0: Proteome Isoelectric Point Database Update. Nucleic Acids Res. 2021, doi: 10.1093/nar/gkab944 | Contact: Lukasz P. Kozlowski |