Thalassotalea mangrovi
Taxonomy: cellular organisms; Bacteria; Proteobacteria; Gammaproteobacteria; Alteromonadales; Colwelliaceae; Thalassotalea
Average proteome isoelectric point is 6.03
Get precalculated fractions of proteins
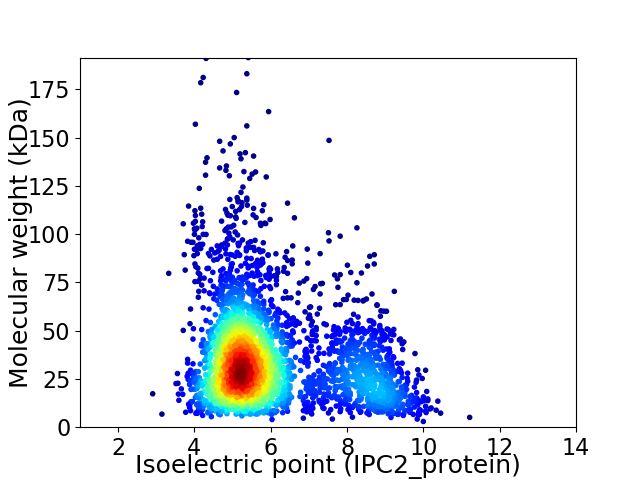
Virtual 2D-PAGE plot for 3157 proteins (isoelectric point calculated using IPC2_protein)
Get csv file with sequences according to given criteria:
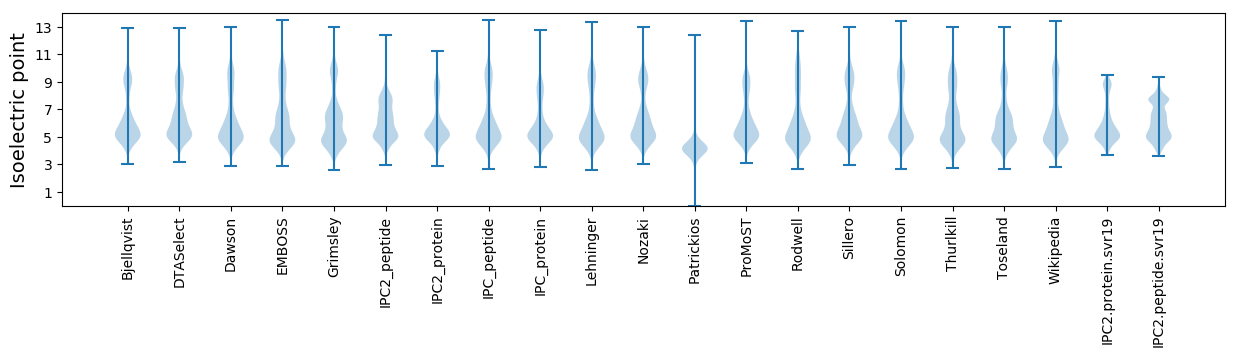
* You can choose from 21 different methods for calculating isoelectric point
Summary statistics related to proteome-wise predictions
Protein with the lowest isoelectric point:
>tr|A0A4U1B4Z6|A0A4U1B4Z6_9GAMM Uncharacterized protein OS=Thalassotalea mangrovi OX=2572245 GN=E8M12_09540 PE=4 SV=1
MM1 pKa = 7.9EE2 pKa = 5.15YY3 pKa = 8.91NTSEE7 pKa = 4.19LCNLYY12 pKa = 9.93TDD14 pKa = 4.41LVDD17 pKa = 3.64VLEE20 pKa = 4.91PMLSNYY26 pKa = 9.79GGRR29 pKa = 11.84SSFGGQVVTIKK40 pKa = 10.68CFEE43 pKa = 4.5ANGLISQMVEE53 pKa = 3.22NDD55 pKa = 3.28GTGKK59 pKa = 10.37VLVIDD64 pKa = 4.47GGGSARR70 pKa = 11.84KK71 pKa = 9.52ALVDD75 pKa = 3.61SYY77 pKa = 11.0IAEE80 pKa = 4.18AAAKK84 pKa = 9.8NGWEE88 pKa = 4.48GIICYY93 pKa = 10.4GSVRR97 pKa = 11.84DD98 pKa = 3.69VDD100 pKa = 3.85ALEE103 pKa = 5.06EE104 pKa = 4.08IDD106 pKa = 4.71IGIQAMVSIPVGAVDD121 pKa = 4.76NDD123 pKa = 3.76DD124 pKa = 4.53GEE126 pKa = 4.96IDD128 pKa = 3.77VAVNFAGVTILPEE141 pKa = 3.69DD142 pKa = 4.7HH143 pKa = 7.24IYY145 pKa = 11.29ADD147 pKa = 3.46NTGVVLSPDD156 pKa = 3.74PLDD159 pKa = 4.11IEE161 pKa = 4.46
MM1 pKa = 7.9EE2 pKa = 5.15YY3 pKa = 8.91NTSEE7 pKa = 4.19LCNLYY12 pKa = 9.93TDD14 pKa = 4.41LVDD17 pKa = 3.64VLEE20 pKa = 4.91PMLSNYY26 pKa = 9.79GGRR29 pKa = 11.84SSFGGQVVTIKK40 pKa = 10.68CFEE43 pKa = 4.5ANGLISQMVEE53 pKa = 3.22NDD55 pKa = 3.28GTGKK59 pKa = 10.37VLVIDD64 pKa = 4.47GGGSARR70 pKa = 11.84KK71 pKa = 9.52ALVDD75 pKa = 3.61SYY77 pKa = 11.0IAEE80 pKa = 4.18AAAKK84 pKa = 9.8NGWEE88 pKa = 4.48GIICYY93 pKa = 10.4GSVRR97 pKa = 11.84DD98 pKa = 3.69VDD100 pKa = 3.85ALEE103 pKa = 5.06EE104 pKa = 4.08IDD106 pKa = 4.71IGIQAMVSIPVGAVDD121 pKa = 4.76NDD123 pKa = 3.76DD124 pKa = 4.53GEE126 pKa = 4.96IDD128 pKa = 3.77VAVNFAGVTILPEE141 pKa = 3.69DD142 pKa = 4.7HH143 pKa = 7.24IYY145 pKa = 11.29ADD147 pKa = 3.46NTGVVLSPDD156 pKa = 3.74PLDD159 pKa = 4.11IEE161 pKa = 4.46
Molecular weight: 17.02 kDa
Isoelectric point according different methods:
Protein with the highest isoelectric point:
>tr|A0A4U1B7S3|A0A4U1B7S3_9GAMM Hsp20 family protein OS=Thalassotalea mangrovi OX=2572245 GN=E8M12_05225 PE=3 SV=1
MM1 pKa = 7.45KK2 pKa = 9.51RR3 pKa = 11.84TFQPSVLKK11 pKa = 10.46RR12 pKa = 11.84KK13 pKa = 9.37RR14 pKa = 11.84NHH16 pKa = 5.37GFRR19 pKa = 11.84ARR21 pKa = 11.84MATKK25 pKa = 10.33NGRR28 pKa = 11.84AVIARR33 pKa = 11.84RR34 pKa = 11.84RR35 pKa = 11.84AKK37 pKa = 10.46GRR39 pKa = 11.84AKK41 pKa = 10.69LSAA44 pKa = 3.92
MM1 pKa = 7.45KK2 pKa = 9.51RR3 pKa = 11.84TFQPSVLKK11 pKa = 10.46RR12 pKa = 11.84KK13 pKa = 9.37RR14 pKa = 11.84NHH16 pKa = 5.37GFRR19 pKa = 11.84ARR21 pKa = 11.84MATKK25 pKa = 10.33NGRR28 pKa = 11.84AVIARR33 pKa = 11.84RR34 pKa = 11.84RR35 pKa = 11.84AKK37 pKa = 10.46GRR39 pKa = 11.84AKK41 pKa = 10.69LSAA44 pKa = 3.92
Molecular weight: 5.08 kDa
Isoelectric point according different methods:
Peptides (in silico digests for buttom-up proteomics)
Below you can find in silico digests of the whole proteome with Trypsin, Chymotrypsin, Trypsin+LysC, LysN, ArgC proteases suitable for different mass spec machines.| Try ESI |
 |
|---|
| ChTry ESI |
|
|---|
| ArgC ESI |
|
|---|
| LysN ESI |
|
|---|
| TryLysC ESI |
|
|---|
| Try MALDI |
|
|---|
| ChTry MALDI |
|
|---|
| ArgC MALDI |
|
|---|
| LysN MALDI |
|
|---|
| TryLysC MALDI |
|
|---|
| Try LTQ |
|
|---|
| ChTry LTQ |
|
|---|
| ArgC LTQ |
|
|---|
| LysN LTQ |
|
|---|
| TryLysC LTQ |
|
|---|
| Try MSlow |
|
|---|
| ChTry MSlow |
|
|---|
| ArgC MSlow |
|
|---|
| LysN MSlow |
|
|---|
| TryLysC MSlow |
|
|---|
| Try MShigh |
|
|---|
| ChTry MShigh |
|
|---|
| ArgC MShigh |
|
|---|
| LysN MShigh |
|
|---|
| TryLysC MShigh |
|
|---|
General Statistics
Number of major isoforms |
Number of additional isoforms |
Number of all proteins |
Number of amino acids |
Min. Seq. Length |
Max. Seq. Length |
Avg. Seq. Length |
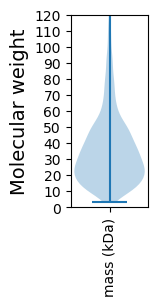
Avg. Mol. Weight |
|---|---|---|---|---|---|---|---|
0 |
1056890 |
25 |
1762 |
334.8 |
37.27 |
Amino acid frequency
Ala |
Cys |
Asp |
Glu |
Phe |
Gly |
His |
Ile |
Lys |
Leu |
|---|---|---|---|---|---|---|---|---|---|
8.657 ± 0.046 | 1.011 ± 0.015 |
5.873 ± 0.036 | 6.013 ± 0.035 |
4.298 ± 0.03 | 6.852 ± 0.038 |
2.224 ± 0.023 | 6.445 ± 0.033 |
5.079 ± 0.037 | 10.212 ± 0.053 |
Met |
Asn |
Gln |
Pro |
Arg |
Ser |
Thr |
Val |
Trp |
Tyr |
|---|---|---|---|---|---|---|---|---|---|
2.535 ± 0.018 | 4.446 ± 0.026 |
3.931 ± 0.027 | 5.135 ± 0.046 |
4.536 ± 0.031 | 6.379 ± 0.029 |
5.141 ± 0.028 | 6.772 ± 0.038 |
1.252 ± 0.015 | 3.208 ± 0.027 |
Most of the basic statistics you can see at this page can be downloaded from this CSV file
See this proteome in:

Proteome-pI is available under Creative Commons Attribution-NoDerivs license, for more details see here
| Reference: Kozlowski LP. Proteome-pI 2.0: Proteome Isoelectric Point Database Update. Nucleic Acids Res. 2021, doi: 10.1093/nar/gkab944 | Contact: Lukasz P. Kozlowski |