Pedobacter antarcticus 4BY
Taxonomy: cellular organisms; Bacteria; FCB group; Bacteroidetes/Chlorobi group; Bacteroidetes; Sphingobacteriia; Sphingobacteriales; Sphingobacteriaceae; Pedobacter; Pedobacter antarcticus
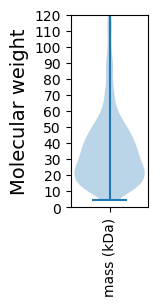
Average proteome isoelectric point is 6.75
Get precalculated fractions of proteins

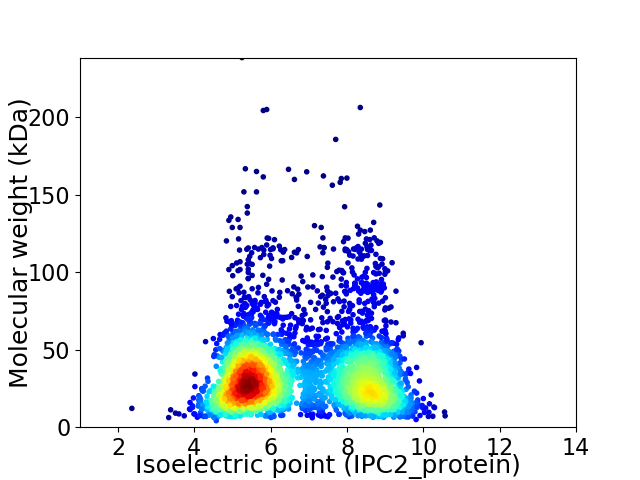
Virtual 2D-PAGE plot for 3836 proteins (isoelectric point calculated using IPC2_protein)
Get csv file with sequences according to given criteria:
* You can choose from 21 different methods for calculating isoelectric point
Summary statistics related to proteome-wise predictions


Protein with the lowest isoelectric point:
>tr|A0A081PCG8|A0A081PCG8_9SPHI Transcriptional regulator OS=Pedobacter antarcticus 4BY OX=1358423 GN=N180_01800 PE=4 SV=1
MM1 pKa = 7.1EE2 pKa = 4.42TTVQLALPEE11 pKa = 4.63DD12 pKa = 4.75FSTLCTIYY20 pKa = 10.39QINPATLIQGFINQVFFPCFYY41 pKa = 10.91SNPTGTDD48 pKa = 2.3RR49 pKa = 11.84WATYY53 pKa = 10.15FFLNFLDD60 pKa = 4.06VEE62 pKa = 4.14EE63 pKa = 5.0DD64 pKa = 3.25AYY66 pKa = 10.63EE67 pKa = 3.87VDD69 pKa = 4.79RR70 pKa = 11.84EE71 pKa = 4.22LEE73 pKa = 4.05EE74 pKa = 4.47PYY76 pKa = 10.96LRR78 pKa = 11.84IFNLRR83 pKa = 11.84LLQLLDD89 pKa = 3.71HH90 pKa = 7.33DD91 pKa = 4.83EE92 pKa = 4.62EE93 pKa = 4.8GTNAA97 pKa = 3.92
MM1 pKa = 7.1EE2 pKa = 4.42TTVQLALPEE11 pKa = 4.63DD12 pKa = 4.75FSTLCTIYY20 pKa = 10.39QINPATLIQGFINQVFFPCFYY41 pKa = 10.91SNPTGTDD48 pKa = 2.3RR49 pKa = 11.84WATYY53 pKa = 10.15FFLNFLDD60 pKa = 4.06VEE62 pKa = 4.14EE63 pKa = 5.0DD64 pKa = 3.25AYY66 pKa = 10.63EE67 pKa = 3.87VDD69 pKa = 4.79RR70 pKa = 11.84EE71 pKa = 4.22LEE73 pKa = 4.05EE74 pKa = 4.47PYY76 pKa = 10.96LRR78 pKa = 11.84IFNLRR83 pKa = 11.84LLQLLDD89 pKa = 3.71HH90 pKa = 7.33DD91 pKa = 4.83EE92 pKa = 4.62EE93 pKa = 4.8GTNAA97 pKa = 3.92
Molecular weight: 11.4 kDa
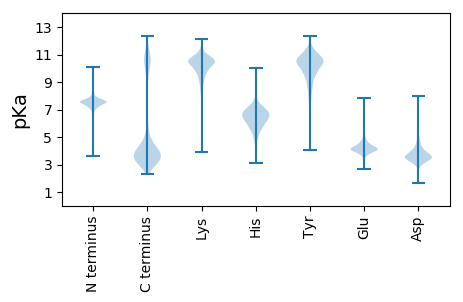
Isoelectric point according different methods:
Protein with the highest isoelectric point:
>tr|A0A081PIP8|A0A081PIP8_9SPHI Uncharacterized protein OS=Pedobacter antarcticus 4BY OX=1358423 GN=N180_04930 PE=4 SV=1
MM1 pKa = 7.43GVFGLLTAEE10 pKa = 4.26YY11 pKa = 10.07LPASLLTPMAAEE23 pKa = 4.36LKK25 pKa = 10.31VSEE28 pKa = 4.51AVAGQAVTVTAIAALFSGLLLPGLTRR54 pKa = 11.84SIDD57 pKa = 3.41RR58 pKa = 11.84RR59 pKa = 11.84VVLLGFSALMIVSNLLVAFSSSIVVLLVMRR89 pKa = 11.84TLLGVALGGFWAMTAAVAMRR109 pKa = 11.84LVPVALVPRR118 pKa = 11.84ALSIIFSGIAVGTVVSVPLGSYY140 pKa = 9.8LGGMFGWRR148 pKa = 11.84SAFYY152 pKa = 9.91ASAGIGVVTLAFQWLTLPSLMPQRR176 pKa = 11.84TVKK179 pKa = 10.04TITVLQVLLRR189 pKa = 11.84PGIAVGMLGCVLAHH203 pKa = 6.33MGHH206 pKa = 6.22YY207 pKa = 11.03ALFTYY212 pKa = 10.13IRR214 pKa = 11.84PFLEE218 pKa = 3.98STVGIGAEE226 pKa = 4.16GLALILLGFGVANFAGTLLAGRR248 pKa = 11.84LLEE251 pKa = 4.16HH252 pKa = 6.63SLRR255 pKa = 11.84GTLIFMPVLVGVVALILVLIPSSFASHH282 pKa = 6.95ALLIAIWGMAFGGVPVAWSAWVARR306 pKa = 11.84AVPDD310 pKa = 3.5QAEE313 pKa = 4.41SAGGMVVASVQGAIAAGAAAGGLLFSFTGIVGVFVAAGISMVLAGLLIALWVRR366 pKa = 11.84VQHH369 pKa = 6.28PGVVQRR375 pKa = 5.01
MM1 pKa = 7.43GVFGLLTAEE10 pKa = 4.26YY11 pKa = 10.07LPASLLTPMAAEE23 pKa = 4.36LKK25 pKa = 10.31VSEE28 pKa = 4.51AVAGQAVTVTAIAALFSGLLLPGLTRR54 pKa = 11.84SIDD57 pKa = 3.41RR58 pKa = 11.84RR59 pKa = 11.84VVLLGFSALMIVSNLLVAFSSSIVVLLVMRR89 pKa = 11.84TLLGVALGGFWAMTAAVAMRR109 pKa = 11.84LVPVALVPRR118 pKa = 11.84ALSIIFSGIAVGTVVSVPLGSYY140 pKa = 9.8LGGMFGWRR148 pKa = 11.84SAFYY152 pKa = 9.91ASAGIGVVTLAFQWLTLPSLMPQRR176 pKa = 11.84TVKK179 pKa = 10.04TITVLQVLLRR189 pKa = 11.84PGIAVGMLGCVLAHH203 pKa = 6.33MGHH206 pKa = 6.22YY207 pKa = 11.03ALFTYY212 pKa = 10.13IRR214 pKa = 11.84PFLEE218 pKa = 3.98STVGIGAEE226 pKa = 4.16GLALILLGFGVANFAGTLLAGRR248 pKa = 11.84LLEE251 pKa = 4.16HH252 pKa = 6.63SLRR255 pKa = 11.84GTLIFMPVLVGVVALILVLIPSSFASHH282 pKa = 6.95ALLIAIWGMAFGGVPVAWSAWVARR306 pKa = 11.84AVPDD310 pKa = 3.5QAEE313 pKa = 4.41SAGGMVVASVQGAIAAGAAAGGLLFSFTGIVGVFVAAGISMVLAGLLIALWVRR366 pKa = 11.84VQHH369 pKa = 6.28PGVVQRR375 pKa = 5.01
Molecular weight: 38.56 kDa
Isoelectric point according different methods:
Peptides (in silico digests for buttom-up proteomics)
Below you can find in silico digests of the whole proteome with Trypsin, Chymotrypsin, Trypsin+LysC, LysN, ArgC proteases suitable for different mass spec machines.| Try ESI |
 |
|---|
| ChTry ESI |
 |
|---|
| ArgC ESI |
 |
|---|
| LysN ESI |
 |
|---|
| TryLysC ESI |
 |
|---|
| Try MALDI |
 |
|---|
| ChTry MALDI |
 |
|---|
| ArgC MALDI |
 |
|---|
| LysN MALDI |
 |
|---|
| TryLysC MALDI |
 |
|---|
| Try LTQ |
 |
|---|
| ChTry LTQ |
 |
|---|
| ArgC LTQ |
 |
|---|
| LysN LTQ |
 |
|---|
| TryLysC LTQ |
 |
|---|
| Try MSlow |
 |
|---|
| ChTry MSlow |
 |
|---|
| ArgC MSlow |
 |
|---|
| LysN MSlow |
 |
|---|
| TryLysC MSlow |
 |
|---|
| Try MShigh |
 |
|---|
| ChTry MShigh |
 |
|---|
| ArgC MShigh |
 |
|---|
| LysN MShigh |
 |
|---|
| TryLysC MShigh |
 |
|---|
General Statistics
Number of major isoforms |
Number of additional isoforms |
Number of all proteins |
Number of amino acids |
Min. Seq. Length |
Max. Seq. Length |
Avg. Seq. Length |
Avg. Mol. Weight |
|---|---|---|---|---|---|---|---|
0 |
1283354 |
36 |
2171 |
334.6 |
37.52 |
Amino acid frequency
Ala |
Cys |
Asp |
Glu |
Phe |
Gly |
His |
Ile |
Lys |
Leu |
|---|---|---|---|---|---|---|---|---|---|
7.404 ± 0.037 | 0.757 ± 0.011 |
5.249 ± 0.03 | 5.956 ± 0.039 |
4.942 ± 0.03 | 6.806 ± 0.036 |
1.822 ± 0.02 | 7.474 ± 0.039 |
6.994 ± 0.034 | 9.858 ± 0.044 |
Met |
Asn |
Gln |
Pro |
Arg |
Ser |
Thr |
Val |
Trp |
Tyr |
|---|---|---|---|---|---|---|---|---|---|
2.349 ± 0.017 | 5.401 ± 0.042 |
3.723 ± 0.022 | 3.895 ± 0.026 |
4.005 ± 0.023 | 6.524 ± 0.03 |
5.519 ± 0.029 | 6.24 ± 0.031 |
1.104 ± 0.015 | 3.977 ± 0.029 |
Most of the basic statistics you can see at this page can be downloaded from this CSV file
Proteome-pI is available under Creative Commons Attribution-NoDerivs license, for more details see here
| Reference: Kozlowski LP. Proteome-pI 2.0: Proteome Isoelectric Point Database Update. Nucleic Acids Res. 2021, doi: 10.1093/nar/gkab944 | Contact: Lukasz P. Kozlowski |
