Mucilaginibacter frigoritolerans
Taxonomy: cellular organisms; Bacteria; FCB group; Bacteroidetes/Chlorobi group; Bacteroidetes; Sphingobacteriia; Sphingobacteriales; Sphingobacteriaceae; Mucilaginibacter
Average proteome isoelectric point is 6.79
Get precalculated fractions of proteins

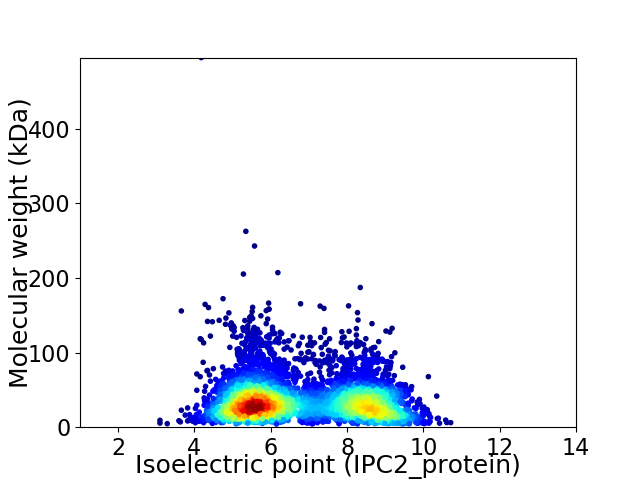
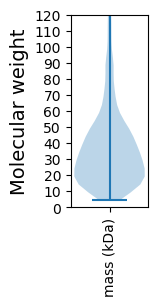
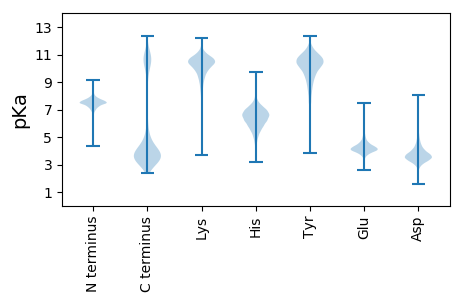
Virtual 2D-PAGE plot for 4865 proteins (isoelectric point calculated using IPC2_protein)
Get csv file with sequences according to given criteria:
* You can choose from 21 different methods for calculating isoelectric point
Summary statistics related to proteome-wise predictions


Protein with the lowest isoelectric point:
>tr|A0A562UC91|A0A562UC91_9SPHI NAD(P)-dependent dehydrogenase (Short-subunit alcohol dehydrogenase family) OS=Mucilaginibacter frigoritolerans OX=652788 GN=JN11_00993 PE=4 SV=1
MM1 pKa = 7.49FKK3 pKa = 10.85NIFSFNGRR11 pKa = 11.84IRR13 pKa = 11.84RR14 pKa = 11.84TEE16 pKa = 3.69FGISYY21 pKa = 9.92IIYY24 pKa = 8.49FVVYY28 pKa = 10.08LFLLAVTGMFHH39 pKa = 6.25QNKK42 pKa = 9.25EE43 pKa = 4.06LFFVFIPLVWFLLAQGSKK61 pKa = 9.9RR62 pKa = 11.84CHH64 pKa = 6.71DD65 pKa = 4.22LGKK68 pKa = 10.57SGWWQIIPFYY78 pKa = 10.69VLWLLFQDD86 pKa = 4.33GDD88 pKa = 4.16PNEE91 pKa = 4.21NEE93 pKa = 4.05YY94 pKa = 11.53GEE96 pKa = 4.16NPKK99 pKa = 10.44FKK101 pKa = 10.45EE102 pKa = 4.04VFDD105 pKa = 4.34AEE107 pKa = 4.56SYY109 pKa = 9.94EE110 pKa = 4.79DD111 pKa = 5.14PIAPPIYY118 pKa = 10.4DD119 pKa = 3.42VLAANAAADD128 pKa = 4.18IIDD131 pKa = 4.56DD132 pKa = 3.91AVMMDD137 pKa = 4.08LAANEE142 pKa = 3.97QQAVNDD148 pKa = 4.07SAYY151 pKa = 11.06LSADD155 pKa = 3.9DD156 pKa = 4.53NTQSDD161 pKa = 4.75LDD163 pKa = 4.11NADD166 pKa = 3.88SSDD169 pKa = 3.84DD170 pKa = 3.63SSSYY174 pKa = 11.14DD175 pKa = 3.27SSDD178 pKa = 3.09SSGSDD183 pKa = 3.12DD184 pKa = 3.58SGSYY188 pKa = 10.58DD189 pKa = 3.52SSDD192 pKa = 3.36SSSSDD197 pKa = 3.4DD198 pKa = 4.63GMDD201 pKa = 3.42SFF203 pKa = 5.83
MM1 pKa = 7.49FKK3 pKa = 10.85NIFSFNGRR11 pKa = 11.84IRR13 pKa = 11.84RR14 pKa = 11.84TEE16 pKa = 3.69FGISYY21 pKa = 9.92IIYY24 pKa = 8.49FVVYY28 pKa = 10.08LFLLAVTGMFHH39 pKa = 6.25QNKK42 pKa = 9.25EE43 pKa = 4.06LFFVFIPLVWFLLAQGSKK61 pKa = 9.9RR62 pKa = 11.84CHH64 pKa = 6.71DD65 pKa = 4.22LGKK68 pKa = 10.57SGWWQIIPFYY78 pKa = 10.69VLWLLFQDD86 pKa = 4.33GDD88 pKa = 4.16PNEE91 pKa = 4.21NEE93 pKa = 4.05YY94 pKa = 11.53GEE96 pKa = 4.16NPKK99 pKa = 10.44FKK101 pKa = 10.45EE102 pKa = 4.04VFDD105 pKa = 4.34AEE107 pKa = 4.56SYY109 pKa = 9.94EE110 pKa = 4.79DD111 pKa = 5.14PIAPPIYY118 pKa = 10.4DD119 pKa = 3.42VLAANAAADD128 pKa = 4.18IIDD131 pKa = 4.56DD132 pKa = 3.91AVMMDD137 pKa = 4.08LAANEE142 pKa = 3.97QQAVNDD148 pKa = 4.07SAYY151 pKa = 11.06LSADD155 pKa = 3.9DD156 pKa = 4.53NTQSDD161 pKa = 4.75LDD163 pKa = 4.11NADD166 pKa = 3.88SSDD169 pKa = 3.84DD170 pKa = 3.63SSSYY174 pKa = 11.14DD175 pKa = 3.27SSDD178 pKa = 3.09SSGSDD183 pKa = 3.12DD184 pKa = 3.58SGSYY188 pKa = 10.58DD189 pKa = 3.52SSDD192 pKa = 3.36SSSSDD197 pKa = 3.4DD198 pKa = 4.63GMDD201 pKa = 3.42SFF203 pKa = 5.83
Molecular weight: 22.74 kDa
Isoelectric point according different methods:
Protein with the highest isoelectric point:
>tr|A0A562TWJ7|A0A562TWJ7_9SPHI Uncharacterized protein OS=Mucilaginibacter frigoritolerans OX=652788 GN=JN11_03522 PE=4 SV=1
MM1 pKa = 7.27FRR3 pKa = 11.84LSCWQSPVKK12 pKa = 10.38RR13 pKa = 11.84RR14 pKa = 11.84LTGLKK19 pKa = 8.31TLKK22 pKa = 10.48FQEE25 pKa = 4.23FLLNRR30 pKa = 11.84QCGYY34 pKa = 10.61YY35 pKa = 10.55GRR37 pKa = 11.84LHH39 pKa = 6.11QATPCALEE47 pKa = 3.76YY48 pKa = 10.37RR49 pKa = 11.84VVLIRR54 pKa = 11.84RR55 pKa = 11.84KK56 pKa = 9.57IAINTQEE63 pKa = 3.72VDD65 pKa = 3.56VVKK68 pKa = 10.66VFRR71 pKa = 11.84KK72 pKa = 9.81CLFVVFRR79 pKa = 11.84NLVINGSGMSKK90 pKa = 10.7LIAGSNNILHH100 pKa = 6.24TLFSILKK107 pKa = 8.93QCTFTPNGNITGKK120 pKa = 10.68GNQNSPP126 pKa = 3.48
MM1 pKa = 7.27FRR3 pKa = 11.84LSCWQSPVKK12 pKa = 10.38RR13 pKa = 11.84RR14 pKa = 11.84LTGLKK19 pKa = 8.31TLKK22 pKa = 10.48FQEE25 pKa = 4.23FLLNRR30 pKa = 11.84QCGYY34 pKa = 10.61YY35 pKa = 10.55GRR37 pKa = 11.84LHH39 pKa = 6.11QATPCALEE47 pKa = 3.76YY48 pKa = 10.37RR49 pKa = 11.84VVLIRR54 pKa = 11.84RR55 pKa = 11.84KK56 pKa = 9.57IAINTQEE63 pKa = 3.72VDD65 pKa = 3.56VVKK68 pKa = 10.66VFRR71 pKa = 11.84KK72 pKa = 9.81CLFVVFRR79 pKa = 11.84NLVINGSGMSKK90 pKa = 10.7LIAGSNNILHH100 pKa = 6.24TLFSILKK107 pKa = 8.93QCTFTPNGNITGKK120 pKa = 10.68GNQNSPP126 pKa = 3.48
Molecular weight: 14.38 kDa
Isoelectric point according different methods:
Peptides (in silico digests for buttom-up proteomics)
Below you can find in silico digests of the whole proteome with Trypsin, Chymotrypsin, Trypsin+LysC, LysN, ArgC proteases suitable for different mass spec machines.| Try ESI |
 |
|---|
| ChTry ESI |
 |
|---|
| ArgC ESI |
 |
|---|
| LysN ESI |
 |
|---|
| TryLysC ESI |
 |
|---|
| Try MALDI |
 |
|---|
| ChTry MALDI |
 |
|---|
| ArgC MALDI |
 |
|---|
| LysN MALDI |
 |
|---|
| TryLysC MALDI |
 |
|---|
| Try LTQ |
 |
|---|
| ChTry LTQ |
 |
|---|
| ArgC LTQ |
 |
|---|
| LysN LTQ |
 |
|---|
| TryLysC LTQ |
 |
|---|
| Try MSlow |
 |
|---|
| ChTry MSlow |
 |
|---|
| ArgC MSlow |
 |
|---|
| LysN MSlow |
 |
|---|
| TryLysC MSlow |
 |
|---|
| Try MShigh |
 |
|---|
| ChTry MShigh |
 |
|---|
| ArgC MShigh |
 |
|---|
| LysN MShigh |
 |
|---|
| TryLysC MShigh |
 |
|---|
General Statistics
Number of major isoforms |
Number of additional isoforms |
Number of all proteins |
Number of amino acids |
Min. Seq. Length |
Max. Seq. Length |
Avg. Seq. Length |
Avg. Mol. Weight |
|---|---|---|---|---|---|---|---|
0 |
1664168 |
39 |
4837 |
342.1 |
38.31 |
Amino acid frequency
Ala |
Cys |
Asp |
Glu |
Phe |
Gly |
His |
Ile |
Lys |
Leu |
|---|---|---|---|---|---|---|---|---|---|
7.364 ± 0.035 | 0.808 ± 0.011 |
5.396 ± 0.024 | 5.207 ± 0.036 |
4.972 ± 0.027 | 6.732 ± 0.033 |
1.938 ± 0.016 | 7.692 ± 0.027 |
7.006 ± 0.033 | 9.432 ± 0.038 |
Met |
Asn |
Gln |
Pro |
Arg |
Ser |
Thr |
Val |
Trp |
Tyr |
|---|---|---|---|---|---|---|---|---|---|
2.189 ± 0.018 | 5.926 ± 0.03 |
3.891 ± 0.023 | 3.711 ± 0.022 |
3.462 ± 0.022 | 6.436 ± 0.032 |
6.052 ± 0.05 | 6.301 ± 0.022 |
1.192 ± 0.014 | 4.292 ± 0.025 |
Most of the basic statistics you can see at this page can be downloaded from this CSV file
Proteome-pI is available under Creative Commons Attribution-NoDerivs license, for more details see here
| Reference: Kozlowski LP. Proteome-pI 2.0: Proteome Isoelectric Point Database Update. Nucleic Acids Res. 2021, doi: 10.1093/nar/gkab944 | Contact: Lukasz P. Kozlowski |
