Leucobacter sp. G161
Taxonomy: cellular organisms; Bacteria; Terrabacteria group; Actinobacteria; Actinomycetia; Micrococcales; Microbacteriaceae; Leucobacter; unclassified Leucobacter
Average proteome isoelectric point is 6.01
Get precalculated fractions of proteins

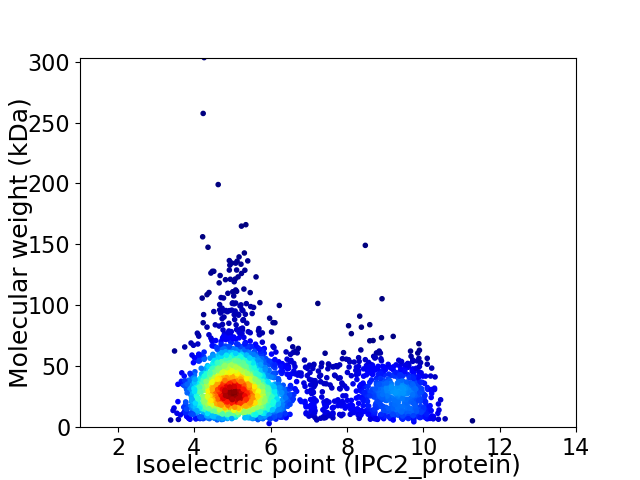
Virtual 2D-PAGE plot for 3093 proteins (isoelectric point calculated using IPC2_protein)
Get csv file with sequences according to given criteria:
* You can choose from 21 different methods for calculating isoelectric point
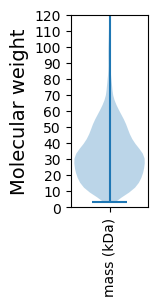
Summary statistics related to proteome-wise predictions


Protein with the lowest isoelectric point:
>tr|A0A0W7W994|A0A0W7W994_9MICO Histidine triad nucleotide-binding protein OS=Leucobacter sp. G161 OX=663704 GN=AUL38_01850 PE=4 SV=1
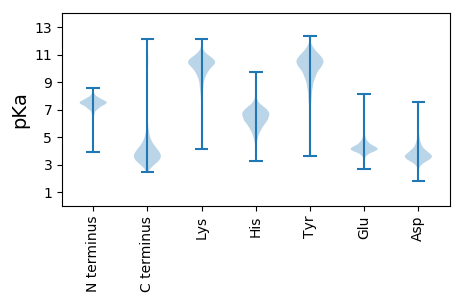
MM1 pKa = 7.46GLALLTGAALALSGCATTGDD21 pKa = 4.31DD22 pKa = 4.71DD23 pKa = 4.91GSPGSAEE30 pKa = 4.48KK31 pKa = 9.79DD32 pKa = 3.29TGPLRR37 pKa = 11.84IGTLLPQSGTLAHH50 pKa = 7.35LIYY53 pKa = 10.57GPQAAVKK60 pKa = 10.25LAMEE64 pKa = 6.04DD65 pKa = 3.23INNAGGVLGQDD76 pKa = 2.71IEE78 pKa = 4.47LVIEE82 pKa = 4.29ANEE85 pKa = 4.17FDD87 pKa = 3.97TTDD90 pKa = 3.14PTIINKK96 pKa = 9.83SVDD99 pKa = 4.29DD100 pKa = 5.23IIAAAPSFVLGAMGTGNTNAAMPRR124 pKa = 11.84LSEE127 pKa = 4.26AGILMGSPSNTGVALSGISDD147 pKa = 3.74SYY149 pKa = 11.41FRR151 pKa = 11.84TIASDD156 pKa = 3.96IIQGRR161 pKa = 11.84ALANLVLHH169 pKa = 7.17DD170 pKa = 3.96GHH172 pKa = 6.51TSVAILAQNNDD183 pKa = 3.62YY184 pKa = 9.14GTGLRR189 pKa = 11.84DD190 pKa = 3.52NFQEE194 pKa = 4.11TLEE197 pKa = 4.27AAGAEE202 pKa = 4.02LVYY205 pKa = 10.49GAEE208 pKa = 4.42GNSEE212 pKa = 4.29EE213 pKa = 4.27FQEE216 pKa = 4.48SQTAFAPEE224 pKa = 3.97VAAVLAQNPEE234 pKa = 3.58ALAIVSYY241 pKa = 10.35EE242 pKa = 3.89EE243 pKa = 3.87AMQIIPEE250 pKa = 4.41LAAQGFDD257 pKa = 3.38LSKK260 pKa = 11.03LYY262 pKa = 10.89LVDD265 pKa = 4.65GNTIPYY271 pKa = 9.74PEE273 pKa = 4.66FDD275 pKa = 3.47AGLLEE280 pKa = 4.74GAQGTTPGRR289 pKa = 11.84ATEE292 pKa = 4.65GEE294 pKa = 4.15FLDD297 pKa = 4.39ALVAADD303 pKa = 4.48SSATQSTNFAPEE315 pKa = 4.02AYY317 pKa = 9.63DD318 pKa = 3.71AVVLVSLAAQKK329 pKa = 11.08GGGTDD334 pKa = 3.35TEE336 pKa = 4.52TIIANLGAVSGADD349 pKa = 3.22GGEE352 pKa = 4.18TCDD355 pKa = 4.01TYY357 pKa = 11.68SDD359 pKa = 4.23CLALLNDD366 pKa = 4.4GQSIHH371 pKa = 5.29YY372 pKa = 9.17QGRR375 pKa = 11.84AGGGPLTDD383 pKa = 3.7GNEE386 pKa = 4.0PSSALIGIYY395 pKa = 9.99RR396 pKa = 11.84YY397 pKa = 10.74DD398 pKa = 3.91DD399 pKa = 3.68TNTPQAVGEE408 pKa = 4.25IEE410 pKa = 4.07GG411 pKa = 3.8
MM1 pKa = 7.46GLALLTGAALALSGCATTGDD21 pKa = 4.31DD22 pKa = 4.71DD23 pKa = 4.91GSPGSAEE30 pKa = 4.48KK31 pKa = 9.79DD32 pKa = 3.29TGPLRR37 pKa = 11.84IGTLLPQSGTLAHH50 pKa = 7.35LIYY53 pKa = 10.57GPQAAVKK60 pKa = 10.25LAMEE64 pKa = 6.04DD65 pKa = 3.23INNAGGVLGQDD76 pKa = 2.71IEE78 pKa = 4.47LVIEE82 pKa = 4.29ANEE85 pKa = 4.17FDD87 pKa = 3.97TTDD90 pKa = 3.14PTIINKK96 pKa = 9.83SVDD99 pKa = 4.29DD100 pKa = 5.23IIAAAPSFVLGAMGTGNTNAAMPRR124 pKa = 11.84LSEE127 pKa = 4.26AGILMGSPSNTGVALSGISDD147 pKa = 3.74SYY149 pKa = 11.41FRR151 pKa = 11.84TIASDD156 pKa = 3.96IIQGRR161 pKa = 11.84ALANLVLHH169 pKa = 7.17DD170 pKa = 3.96GHH172 pKa = 6.51TSVAILAQNNDD183 pKa = 3.62YY184 pKa = 9.14GTGLRR189 pKa = 11.84DD190 pKa = 3.52NFQEE194 pKa = 4.11TLEE197 pKa = 4.27AAGAEE202 pKa = 4.02LVYY205 pKa = 10.49GAEE208 pKa = 4.42GNSEE212 pKa = 4.29EE213 pKa = 4.27FQEE216 pKa = 4.48SQTAFAPEE224 pKa = 3.97VAAVLAQNPEE234 pKa = 3.58ALAIVSYY241 pKa = 10.35EE242 pKa = 3.89EE243 pKa = 3.87AMQIIPEE250 pKa = 4.41LAAQGFDD257 pKa = 3.38LSKK260 pKa = 11.03LYY262 pKa = 10.89LVDD265 pKa = 4.65GNTIPYY271 pKa = 9.74PEE273 pKa = 4.66FDD275 pKa = 3.47AGLLEE280 pKa = 4.74GAQGTTPGRR289 pKa = 11.84ATEE292 pKa = 4.65GEE294 pKa = 4.15FLDD297 pKa = 4.39ALVAADD303 pKa = 4.48SSATQSTNFAPEE315 pKa = 4.02AYY317 pKa = 9.63DD318 pKa = 3.71AVVLVSLAAQKK329 pKa = 11.08GGGTDD334 pKa = 3.35TEE336 pKa = 4.52TIIANLGAVSGADD349 pKa = 3.22GGEE352 pKa = 4.18TCDD355 pKa = 4.01TYY357 pKa = 11.68SDD359 pKa = 4.23CLALLNDD366 pKa = 4.4GQSIHH371 pKa = 5.29YY372 pKa = 9.17QGRR375 pKa = 11.84AGGGPLTDD383 pKa = 3.7GNEE386 pKa = 4.0PSSALIGIYY395 pKa = 9.99RR396 pKa = 11.84YY397 pKa = 10.74DD398 pKa = 3.91DD399 pKa = 3.68TNTPQAVGEE408 pKa = 4.25IEE410 pKa = 4.07GG411 pKa = 3.8
Molecular weight: 41.96 kDa
Isoelectric point according different methods:
Protein with the highest isoelectric point:
>tr|A0A0W7W687|A0A0W7W687_9MICO ABC transporter ATP-binding protein OS=Leucobacter sp. G161 OX=663704 GN=AUL38_15050 PE=4 SV=1
MM1 pKa = 7.69SKK3 pKa = 9.0RR4 pKa = 11.84TFQPNNRR11 pKa = 11.84RR12 pKa = 11.84RR13 pKa = 11.84AKK15 pKa = 9.23VHH17 pKa = 5.46GFRR20 pKa = 11.84SRR22 pKa = 11.84MRR24 pKa = 11.84TRR26 pKa = 11.84AGRR29 pKa = 11.84AIITARR35 pKa = 11.84RR36 pKa = 11.84GKK38 pKa = 10.68GRR40 pKa = 11.84TKK42 pKa = 10.85LSAA45 pKa = 3.61
MM1 pKa = 7.69SKK3 pKa = 9.0RR4 pKa = 11.84TFQPNNRR11 pKa = 11.84RR12 pKa = 11.84RR13 pKa = 11.84AKK15 pKa = 9.23VHH17 pKa = 5.46GFRR20 pKa = 11.84SRR22 pKa = 11.84MRR24 pKa = 11.84TRR26 pKa = 11.84AGRR29 pKa = 11.84AIITARR35 pKa = 11.84RR36 pKa = 11.84GKK38 pKa = 10.68GRR40 pKa = 11.84TKK42 pKa = 10.85LSAA45 pKa = 3.61
Molecular weight: 5.24 kDa
Isoelectric point according different methods:
Peptides (in silico digests for buttom-up proteomics)
Below you can find in silico digests of the whole proteome with Trypsin, Chymotrypsin, Trypsin+LysC, LysN, ArgC proteases suitable for different mass spec machines.| Try ESI |
 |
|---|
| ChTry ESI |
 |
|---|
| ArgC ESI |
 |
|---|
| LysN ESI |
 |
|---|
| TryLysC ESI |
 |
|---|
| Try MALDI |
 |
|---|
| ChTry MALDI |
 |
|---|
| ArgC MALDI |
 |
|---|
| LysN MALDI |
 |
|---|
| TryLysC MALDI |
 |
|---|
| Try LTQ |
 |
|---|
| ChTry LTQ |
 |
|---|
| ArgC LTQ |
 |
|---|
| LysN LTQ |
 |
|---|
| TryLysC LTQ |
 |
|---|
| Try MSlow |
 |
|---|
| ChTry MSlow |
 |
|---|
| ArgC MSlow |
 |
|---|
| LysN MSlow |
 |
|---|
| TryLysC MSlow |
 |
|---|
| Try MShigh |
 |
|---|
| ChTry MShigh |
 |
|---|
| ArgC MShigh |
 |
|---|
| LysN MShigh |
 |
|---|
| TryLysC MShigh |
 |
|---|
General Statistics
Number of major isoforms |
Number of additional isoforms |
Number of all proteins |
Number of amino acids |
Min. Seq. Length |
Max. Seq. Length |
Avg. Seq. Length |
Avg. Mol. Weight |
|---|---|---|---|---|---|---|---|
0 |
999509 |
29 |
2953 |
323.2 |
34.54 |
Amino acid frequency
Ala |
Cys |
Asp |
Glu |
Phe |
Gly |
His |
Ile |
Lys |
Leu |
|---|---|---|---|---|---|---|---|---|---|
13.373 ± 0.065 | 0.511 ± 0.01 |
5.586 ± 0.034 | 6.182 ± 0.047 |
3.267 ± 0.027 | 9.051 ± 0.04 |
1.979 ± 0.023 | 4.789 ± 0.034 |
2.229 ± 0.034 | 10.375 ± 0.049 |
Met |
Asn |
Gln |
Pro |
Arg |
Ser |
Thr |
Val |
Trp |
Tyr |
|---|---|---|---|---|---|---|---|---|---|
1.924 ± 0.02 | 2.146 ± 0.023 |
5.191 ± 0.028 | 2.995 ± 0.021 |
6.741 ± 0.046 | 5.792 ± 0.03 |
6.134 ± 0.034 | 8.448 ± 0.041 |
1.394 ± 0.017 | 1.893 ± 0.021 |
Most of the basic statistics you can see at this page can be downloaded from this CSV file
Proteome-pI is available under Creative Commons Attribution-NoDerivs license, for more details see here
| Reference: Kozlowski LP. Proteome-pI 2.0: Proteome Isoelectric Point Database Update. Nucleic Acids Res. 2021, doi: 10.1093/nar/gkab944 | Contact: Lukasz P. Kozlowski |
