Streptacidiphilus jiangxiensis
Taxonomy: cellular organisms; Bacteria; Terrabacteria group; Actinobacteria; Actinomycetia; Streptomycetales; Streptomycetaceae; Streptacidiphilus
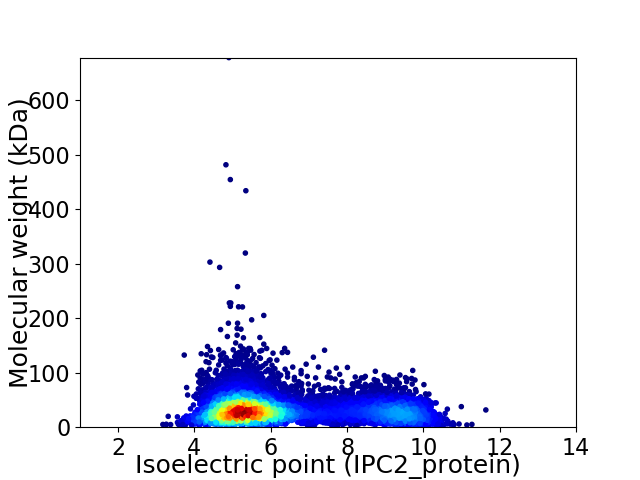
Average proteome isoelectric point is 6.36
Get precalculated fractions of proteins

Virtual 2D-PAGE plot for 8703 proteins (isoelectric point calculated using IPC2_protein)
Get csv file with sequences according to given criteria:
* You can choose from 21 different methods for calculating isoelectric point
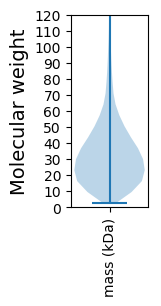
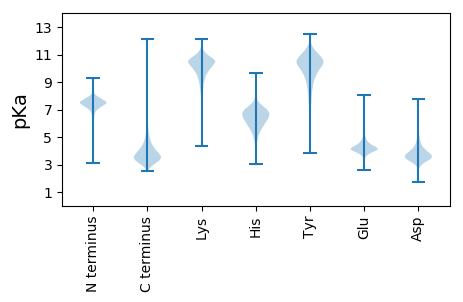
Summary statistics related to proteome-wise predictions


Protein with the lowest isoelectric point:
>tr|A0A1H8B5B7|A0A1H8B5B7_STRJI Uncharacterized protein OS=Streptacidiphilus jiangxiensis OX=235985 GN=SAMN05414137_15718 PE=4 SV=1
MM1 pKa = 7.7LIEE4 pKa = 4.85LPFLVAEE11 pKa = 5.02LRR13 pKa = 11.84ASMVDD18 pKa = 4.17GYY20 pKa = 9.74TPDD23 pKa = 3.41DD24 pKa = 3.79VNRR27 pKa = 11.84AFGRR31 pKa = 11.84IKK33 pKa = 10.72DD34 pKa = 3.76ALGVDD39 pKa = 4.84LVCVWEE45 pKa = 3.89YY46 pKa = 11.32HH47 pKa = 7.56DD48 pKa = 4.93DD49 pKa = 3.7FGYY52 pKa = 11.03GGNSDD57 pKa = 4.13FYY59 pKa = 11.24VRR61 pKa = 11.84SAEE64 pKa = 4.28GAVHH68 pKa = 6.74EE69 pKa = 4.45LAGYY73 pKa = 8.43LWPWLNRR80 pKa = 11.84ALDD83 pKa = 3.97DD84 pKa = 4.39PEE86 pKa = 6.3APEE89 pKa = 4.97HH90 pKa = 6.52PGDD93 pKa = 3.76PATWTGPTSDD103 pKa = 4.01VTDD106 pKa = 4.67DD107 pKa = 3.97LADD110 pKa = 4.51DD111 pKa = 4.97GFHH114 pKa = 6.53NAAPPSEE121 pKa = 4.0RR122 pKa = 11.84CGNEE126 pKa = 3.36EE127 pKa = 4.86CRR129 pKa = 11.84DD130 pKa = 3.69EE131 pKa = 5.18LGGNGYY137 pKa = 10.56DD138 pKa = 4.48GLCDD142 pKa = 3.33SCADD146 pKa = 3.84RR147 pKa = 11.84TFGDD151 pKa = 3.36NDD153 pKa = 3.3YY154 pKa = 11.68DD155 pKa = 3.83LL156 pKa = 6.07
MM1 pKa = 7.7LIEE4 pKa = 4.85LPFLVAEE11 pKa = 5.02LRR13 pKa = 11.84ASMVDD18 pKa = 4.17GYY20 pKa = 9.74TPDD23 pKa = 3.41DD24 pKa = 3.79VNRR27 pKa = 11.84AFGRR31 pKa = 11.84IKK33 pKa = 10.72DD34 pKa = 3.76ALGVDD39 pKa = 4.84LVCVWEE45 pKa = 3.89YY46 pKa = 11.32HH47 pKa = 7.56DD48 pKa = 4.93DD49 pKa = 3.7FGYY52 pKa = 11.03GGNSDD57 pKa = 4.13FYY59 pKa = 11.24VRR61 pKa = 11.84SAEE64 pKa = 4.28GAVHH68 pKa = 6.74EE69 pKa = 4.45LAGYY73 pKa = 8.43LWPWLNRR80 pKa = 11.84ALDD83 pKa = 3.97DD84 pKa = 4.39PEE86 pKa = 6.3APEE89 pKa = 4.97HH90 pKa = 6.52PGDD93 pKa = 3.76PATWTGPTSDD103 pKa = 4.01VTDD106 pKa = 4.67DD107 pKa = 3.97LADD110 pKa = 4.51DD111 pKa = 4.97GFHH114 pKa = 6.53NAAPPSEE121 pKa = 4.0RR122 pKa = 11.84CGNEE126 pKa = 3.36EE127 pKa = 4.86CRR129 pKa = 11.84DD130 pKa = 3.69EE131 pKa = 5.18LGGNGYY137 pKa = 10.56DD138 pKa = 4.48GLCDD142 pKa = 3.33SCADD146 pKa = 3.84RR147 pKa = 11.84TFGDD151 pKa = 3.36NDD153 pKa = 3.3YY154 pKa = 11.68DD155 pKa = 3.83LL156 pKa = 6.07
Molecular weight: 17.13 kDa
Isoelectric point according different methods:
Protein with the highest isoelectric point:
>tr|A0A1H7JH27|A0A1H7JH27_STRJI Spermidine/putrescine transport system permease protein OS=Streptacidiphilus jiangxiensis OX=235985 GN=SAMN05414137_103283 PE=3 SV=1
MM1 pKa = 7.69SKK3 pKa = 9.0RR4 pKa = 11.84TFQPNNRR11 pKa = 11.84RR12 pKa = 11.84RR13 pKa = 11.84AKK15 pKa = 8.7THH17 pKa = 5.15GFRR20 pKa = 11.84LRR22 pKa = 11.84MRR24 pKa = 11.84TRR26 pKa = 11.84AGRR29 pKa = 11.84AILAARR35 pKa = 11.84RR36 pKa = 11.84GKK38 pKa = 10.51GRR40 pKa = 11.84SSLSAA45 pKa = 3.62
MM1 pKa = 7.69SKK3 pKa = 9.0RR4 pKa = 11.84TFQPNNRR11 pKa = 11.84RR12 pKa = 11.84RR13 pKa = 11.84AKK15 pKa = 8.7THH17 pKa = 5.15GFRR20 pKa = 11.84LRR22 pKa = 11.84MRR24 pKa = 11.84TRR26 pKa = 11.84AGRR29 pKa = 11.84AILAARR35 pKa = 11.84RR36 pKa = 11.84GKK38 pKa = 10.51GRR40 pKa = 11.84SSLSAA45 pKa = 3.62
Molecular weight: 5.18 kDa
Isoelectric point according different methods:
Peptides (in silico digests for buttom-up proteomics)
Below you can find in silico digests of the whole proteome with Trypsin, Chymotrypsin, Trypsin+LysC, LysN, ArgC proteases suitable for different mass spec machines.| Try ESI |
 |
|---|
| ChTry ESI |
 |
|---|
| ArgC ESI |
 |
|---|
| LysN ESI |
 |
|---|
| TryLysC ESI |
 |
|---|
| Try MALDI |
 |
|---|
| ChTry MALDI |
 |
|---|
| ArgC MALDI |
 |
|---|
| LysN MALDI |
 |
|---|
| TryLysC MALDI |
 |
|---|
| Try LTQ |
 |
|---|
| ChTry LTQ |
 |
|---|
| ArgC LTQ |
 |
|---|
| LysN LTQ |
 |
|---|
| TryLysC LTQ |
 |
|---|
| Try MSlow |
 |
|---|
| ChTry MSlow |
 |
|---|
| ArgC MSlow |
 |
|---|
| LysN MSlow |
 |
|---|
| TryLysC MSlow |
 |
|---|
| Try MShigh |
 |
|---|
| ChTry MShigh |
 |
|---|
| ArgC MShigh |
 |
|---|
| LysN MShigh |
 |
|---|
| TryLysC MShigh |
 |
|---|
General Statistics
Number of major isoforms |
Number of additional isoforms |
Number of all proteins |
Number of amino acids |
Min. Seq. Length |
Max. Seq. Length |
Avg. Seq. Length |
Avg. Mol. Weight |
|---|---|---|---|---|---|---|---|
0 |
2823145 |
25 |
6380 |
324.4 |
34.53 |
Amino acid frequency
Ala |
Cys |
Asp |
Glu |
Phe |
Gly |
His |
Ile |
Lys |
Leu |
|---|---|---|---|---|---|---|---|---|---|
14.259 ± 0.042 | 0.815 ± 0.007 |
5.626 ± 0.022 | 5.246 ± 0.032 |
2.734 ± 0.015 | 9.48 ± 0.031 |
2.337 ± 0.015 | 2.95 ± 0.019 |
1.65 ± 0.018 | 10.833 ± 0.043 |
Met |
Asn |
Gln |
Pro |
Arg |
Ser |
Thr |
Val |
Trp |
Tyr |
|---|---|---|---|---|---|---|---|---|---|
1.645 ± 0.01 | 1.814 ± 0.018 |
6.222 ± 0.029 | 3.091 ± 0.016 |
7.7 ± 0.033 | 5.251 ± 0.024 |
6.234 ± 0.03 | 8.519 ± 0.024 |
1.577 ± 0.013 | 2.017 ± 0.014 |
Most of the basic statistics you can see at this page can be downloaded from this CSV file
Proteome-pI is available under Creative Commons Attribution-NoDerivs license, for more details see here
| Reference: Kozlowski LP. Proteome-pI 2.0: Proteome Isoelectric Point Database Update. Nucleic Acids Res. 2021, doi: 10.1093/nar/gkab944 | Contact: Lukasz P. Kozlowski |
