Gluconobacter phage GC1
Taxonomy: Viruses; Varidnaviria; Bamfordvirae; Preplasmiviricota; Tectiliviricetes; Kalamavirales; Tectiviridae; Gammatectivirus; Gluconobacter virus GC1
Average proteome isoelectric point is 6.26
Get precalculated fractions of proteins

Virtual 2D-PAGE plot for 36 proteins (isoelectric point calculated using IPC2_protein)
Get csv file with sequences according to given criteria:
* You can choose from 21 different methods for calculating isoelectric point
Summary statistics related to proteome-wise predictions


Protein with the lowest isoelectric point:
>tr|A0A2I5AR68|A0A2I5AR68_9VIRU Uncharacterized protein OS=Gluconobacter phage GC1 OX=2047788 GN=GC1_00007 PE=4 SV=1
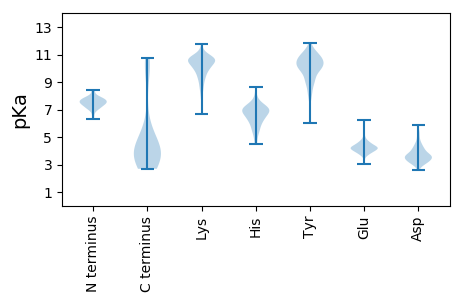
MM1 pKa = 7.68GFLLCALCAFTQEE14 pKa = 4.31GFNMALLSPAMQSKK28 pKa = 8.45STARR32 pKa = 11.84GKK34 pKa = 10.95VIDD37 pKa = 5.39QFVTWDD43 pKa = 3.3ATDD46 pKa = 3.17TDD48 pKa = 4.97GIVFDD53 pKa = 5.3FTAQGNAMLLRR64 pKa = 11.84EE65 pKa = 4.38PVCVFVDD72 pKa = 3.42NTRR75 pKa = 11.84ATGQLTITVEE85 pKa = 4.65GYY87 pKa = 10.53AYY89 pKa = 10.45QLVVQPGMIASLPFMSVALPRR110 pKa = 11.84VTVKK114 pKa = 10.66SSEE117 pKa = 4.19GTSGVTSFIFCDD129 pKa = 4.47FMLPNFAYY137 pKa = 8.77EE138 pKa = 4.03ATGISQKK145 pKa = 8.05TTDD148 pKa = 3.84TILEE152 pKa = 4.25EE153 pKa = 4.43VVSGGIGSEE162 pKa = 4.14SLRR165 pKa = 11.84VTDD168 pKa = 4.96AEE170 pKa = 4.71AIALLTTINSALSDD184 pKa = 3.53SGSTGNSSNATLKK197 pKa = 10.99AILAQLKK204 pKa = 7.44EE205 pKa = 4.33TLSVSDD211 pKa = 4.68ADD213 pKa = 4.39VLAQLKK219 pKa = 6.65TTLAVNDD226 pKa = 3.67GDD228 pKa = 5.89AIAEE232 pKa = 4.24LNVIEE237 pKa = 4.4ATLEE241 pKa = 3.9NSDD244 pKa = 3.5FTKK247 pKa = 10.66SVNVTGRR254 pKa = 11.84IQSSWIKK261 pKa = 10.56NVFNGSCLIDD271 pKa = 3.75KK272 pKa = 8.1LTVFPTDD279 pKa = 3.83PGSSVYY285 pKa = 10.5LAIFNEE291 pKa = 4.52TVPNSGQEE299 pKa = 4.03DD300 pKa = 3.97VTLKK304 pKa = 10.91VVGIYY309 pKa = 9.81PISKK313 pKa = 10.57GDD315 pKa = 3.5ILTLDD320 pKa = 4.06FSAPVFASTSFTIGFFASYY339 pKa = 8.57PIPGTGIAGSNSEE352 pKa = 4.62VYY354 pKa = 10.1DD355 pKa = 3.3VSYY358 pKa = 10.24IAQYY362 pKa = 10.79RR363 pKa = 11.84PVGNN367 pKa = 3.68
MM1 pKa = 7.68GFLLCALCAFTQEE14 pKa = 4.31GFNMALLSPAMQSKK28 pKa = 8.45STARR32 pKa = 11.84GKK34 pKa = 10.95VIDD37 pKa = 5.39QFVTWDD43 pKa = 3.3ATDD46 pKa = 3.17TDD48 pKa = 4.97GIVFDD53 pKa = 5.3FTAQGNAMLLRR64 pKa = 11.84EE65 pKa = 4.38PVCVFVDD72 pKa = 3.42NTRR75 pKa = 11.84ATGQLTITVEE85 pKa = 4.65GYY87 pKa = 10.53AYY89 pKa = 10.45QLVVQPGMIASLPFMSVALPRR110 pKa = 11.84VTVKK114 pKa = 10.66SSEE117 pKa = 4.19GTSGVTSFIFCDD129 pKa = 4.47FMLPNFAYY137 pKa = 8.77EE138 pKa = 4.03ATGISQKK145 pKa = 8.05TTDD148 pKa = 3.84TILEE152 pKa = 4.25EE153 pKa = 4.43VVSGGIGSEE162 pKa = 4.14SLRR165 pKa = 11.84VTDD168 pKa = 4.96AEE170 pKa = 4.71AIALLTTINSALSDD184 pKa = 3.53SGSTGNSSNATLKK197 pKa = 10.99AILAQLKK204 pKa = 7.44EE205 pKa = 4.33TLSVSDD211 pKa = 4.68ADD213 pKa = 4.39VLAQLKK219 pKa = 6.65TTLAVNDD226 pKa = 3.67GDD228 pKa = 5.89AIAEE232 pKa = 4.24LNVIEE237 pKa = 4.4ATLEE241 pKa = 3.9NSDD244 pKa = 3.5FTKK247 pKa = 10.66SVNVTGRR254 pKa = 11.84IQSSWIKK261 pKa = 10.56NVFNGSCLIDD271 pKa = 3.75KK272 pKa = 8.1LTVFPTDD279 pKa = 3.83PGSSVYY285 pKa = 10.5LAIFNEE291 pKa = 4.52TVPNSGQEE299 pKa = 4.03DD300 pKa = 3.97VTLKK304 pKa = 10.91VVGIYY309 pKa = 9.81PISKK313 pKa = 10.57GDD315 pKa = 3.5ILTLDD320 pKa = 4.06FSAPVFASTSFTIGFFASYY339 pKa = 8.57PIPGTGIAGSNSEE352 pKa = 4.62VYY354 pKa = 10.1DD355 pKa = 3.3VSYY358 pKa = 10.24IAQYY362 pKa = 10.79RR363 pKa = 11.84PVGNN367 pKa = 3.68
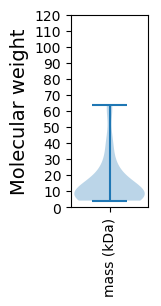
Molecular weight: 38.88 kDa
Isoelectric point according different methods:
Protein with the highest isoelectric point:
>tr|A0A2I5AR73|A0A2I5AR73_9VIRU Uncharacterized protein OS=Gluconobacter phage GC1 OX=2047788 GN=GC1_00011 PE=4 SV=1
MM1 pKa = 7.96AIKK4 pKa = 9.98QWFIGLKK11 pKa = 9.99GKK13 pKa = 10.19RR14 pKa = 11.84LSLGAAQYY22 pKa = 11.21GFAGDD27 pKa = 3.69GALKK31 pKa = 10.08IVRR34 pKa = 11.84DD35 pKa = 4.06GNTVNNVQRR44 pKa = 11.84QIRR47 pKa = 11.84TMGAYY52 pKa = 7.95NTVPVLGQFVGVAQSSGSPKK72 pKa = 9.18TQGLQRR78 pKa = 11.84NPLTNDD84 pKa = 3.19LLTRR88 pKa = 11.84LYY90 pKa = 10.88GQGGQSS96 pKa = 2.94
MM1 pKa = 7.96AIKK4 pKa = 9.98QWFIGLKK11 pKa = 9.99GKK13 pKa = 10.19RR14 pKa = 11.84LSLGAAQYY22 pKa = 11.21GFAGDD27 pKa = 3.69GALKK31 pKa = 10.08IVRR34 pKa = 11.84DD35 pKa = 4.06GNTVNNVQRR44 pKa = 11.84QIRR47 pKa = 11.84TMGAYY52 pKa = 7.95NTVPVLGQFVGVAQSSGSPKK72 pKa = 9.18TQGLQRR78 pKa = 11.84NPLTNDD84 pKa = 3.19LLTRR88 pKa = 11.84LYY90 pKa = 10.88GQGGQSS96 pKa = 2.94
Molecular weight: 10.25 kDa
Isoelectric point according different methods:
Peptides (in silico digests for buttom-up proteomics)
Below you can find in silico digests of the whole proteome with Trypsin, Chymotrypsin, Trypsin+LysC, LysN, ArgC proteases suitable for different mass spec machines.| Try ESI |
 |
|---|
| ChTry ESI |
 |
|---|
| ArgC ESI |
 |
|---|
| LysN ESI |
 |
|---|
| TryLysC ESI |
 |
|---|
| Try MALDI |
 |
|---|
| ChTry MALDI |
 |
|---|
| ArgC MALDI |
 |
|---|
| LysN MALDI |
 |
|---|
| TryLysC MALDI |
 |
|---|
| Try LTQ |
 |
|---|
| ChTry LTQ |
 |
|---|
| ArgC LTQ |
 |
|---|
| LysN LTQ |
 |
|---|
| TryLysC LTQ |
 |
|---|
| Try MSlow |
 |
|---|
| ChTry MSlow |
 |
|---|
| ArgC MSlow |
 |
|---|
| LysN MSlow |
 |
|---|
| TryLysC MSlow |
 |
|---|
| Try MShigh |
 |
|---|
| ChTry MShigh |
 |
|---|
| ArgC MShigh |
 |
|---|
| LysN MShigh |
 |
|---|
| TryLysC MShigh |
 |
|---|
General Statistics
Number of major isoforms |
Number of additional isoforms |
Number of all proteins |
Number of amino acids |
Min. Seq. Length |
Max. Seq. Length |
Avg. Seq. Length |
Avg. Mol. Weight |
|---|---|---|---|---|---|---|---|
0 |
5036 |
38 |
561 |
139.9 |
15.29 |
Amino acid frequency
Ala |
Cys |
Asp |
Glu |
Phe |
Gly |
His |
Ile |
Lys |
Leu |
|---|---|---|---|---|---|---|---|---|---|
10.346 ± 0.771 | 0.913 ± 0.271 |
5.5 ± 0.403 | 5.56 ± 0.795 |
4.051 ± 0.404 | 7.824 ± 0.56 |
1.191 ± 0.198 | 6.116 ± 0.355 |
4.944 ± 0.827 | 7.605 ± 0.554 |
Met |
Asn |
Gln |
Pro |
Arg |
Ser |
Thr |
Val |
Trp |
Tyr |
|---|---|---|---|---|---|---|---|---|---|
3.237 ± 0.3 | 4.567 ± 0.634 |
3.852 ± 0.338 | 3.376 ± 0.375 |
4.865 ± 0.621 | 7.347 ± 0.533 |
6.851 ± 0.725 | 7.327 ± 0.428 |
1.35 ± 0.177 | 3.177 ± 0.431 |
Most of the basic statistics you can see at this page can be downloaded from this CSV file
Proteome-pI is available under Creative Commons Attribution-NoDerivs license, for more details see here
| Reference: Kozlowski LP. Proteome-pI 2.0: Proteome Isoelectric Point Database Update. Nucleic Acids Res. 2021, doi: 10.1093/nar/gkab944 | Contact: Lukasz P. Kozlowski |
