Gordonia phage GordDuk1
Taxonomy: Viruses; Duplodnaviria; Heunggongvirae; Uroviricota; Caudoviricetes; Caudovirales; Siphoviridae; Gordtnkvirus; unclassified Gordtnkvirus
Average proteome isoelectric point is 5.99
Get precalculated fractions of proteins
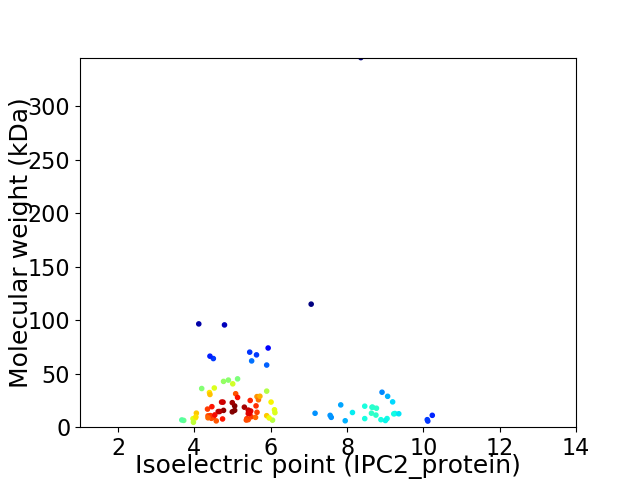
Virtual 2D-PAGE plot for 97 proteins (isoelectric point calculated using IPC2_protein)
Get csv file with sequences according to given criteria:
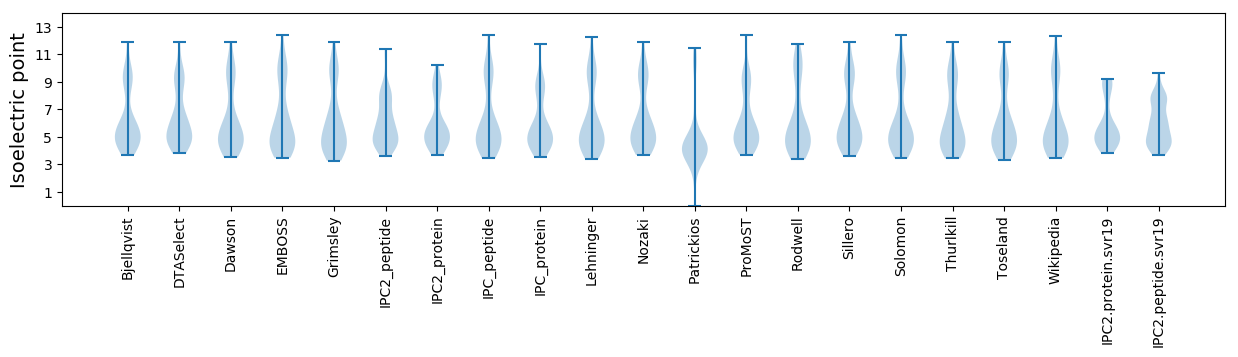
* You can choose from 21 different methods for calculating isoelectric point
Summary statistics related to proteome-wise predictions
Protein with the lowest isoelectric point:
>tr|A0A0E3T6W6|A0A0E3T6W6_9CAUD Uncharacterized protein OS=Gordonia phage GordDuk1 OX=1622191 GN=GordDuk1_81 PE=4 SV=1
MM1 pKa = 8.3AEE3 pKa = 4.05MYY5 pKa = 8.2EE6 pKa = 4.28PPGSRR11 pKa = 11.84EE12 pKa = 4.03LMDD15 pKa = 4.16EE16 pKa = 4.74LSLAEE21 pKa = 4.39QNPIAQGDD29 pKa = 3.97GWSLLGPFAADD40 pKa = 3.31GTYY43 pKa = 10.78LPDD46 pKa = 4.21LEE48 pKa = 6.21AGVRR52 pKa = 11.84YY53 pKa = 10.13DD54 pKa = 3.38SASNTVIIPP63 pKa = 3.71
MM1 pKa = 8.3AEE3 pKa = 4.05MYY5 pKa = 8.2EE6 pKa = 4.28PPGSRR11 pKa = 11.84EE12 pKa = 4.03LMDD15 pKa = 4.16EE16 pKa = 4.74LSLAEE21 pKa = 4.39QNPIAQGDD29 pKa = 3.97GWSLLGPFAADD40 pKa = 3.31GTYY43 pKa = 10.78LPDD46 pKa = 4.21LEE48 pKa = 6.21AGVRR52 pKa = 11.84YY53 pKa = 10.13DD54 pKa = 3.38SASNTVIIPP63 pKa = 3.71
Molecular weight: 6.77 kDa
Isoelectric point according different methods:
Protein with the highest isoelectric point:
>tr|A0A0E3T645|A0A0E3T645_9CAUD DNA binding domain protein OS=Gordonia phage GordDuk1 OX=1622191 GN=GordDuk1_58 PE=4 SV=1
MM1 pKa = 7.2QNQDD5 pKa = 3.27MRR7 pKa = 11.84HH8 pKa = 5.16SSEE11 pKa = 3.84MAKK14 pKa = 10.5YY15 pKa = 9.78LAIASGLTGKK25 pKa = 10.09RR26 pKa = 11.84QEE28 pKa = 3.91LQAAKK33 pKa = 10.09KK34 pKa = 10.52AKK36 pKa = 10.4DD37 pKa = 3.22KK38 pKa = 11.1AKK40 pKa = 10.43RR41 pKa = 11.84RR42 pKa = 11.84AKK44 pKa = 10.25RR45 pKa = 11.84KK46 pKa = 7.73RR47 pKa = 11.84TGRR50 pKa = 3.49
MM1 pKa = 7.2QNQDD5 pKa = 3.27MRR7 pKa = 11.84HH8 pKa = 5.16SSEE11 pKa = 3.84MAKK14 pKa = 10.5YY15 pKa = 9.78LAIASGLTGKK25 pKa = 10.09RR26 pKa = 11.84QEE28 pKa = 3.91LQAAKK33 pKa = 10.09KK34 pKa = 10.52AKK36 pKa = 10.4DD37 pKa = 3.22KK38 pKa = 11.1AKK40 pKa = 10.43RR41 pKa = 11.84RR42 pKa = 11.84AKK44 pKa = 10.25RR45 pKa = 11.84KK46 pKa = 7.73RR47 pKa = 11.84TGRR50 pKa = 3.49
Molecular weight: 5.73 kDa
Isoelectric point according different methods:
Peptides (in silico digests for buttom-up proteomics)
Below you can find in silico digests of the whole proteome with Trypsin, Chymotrypsin, Trypsin+LysC, LysN, ArgC proteases suitable for different mass spec machines.| Try ESI |
 |
|---|
| ChTry ESI |
|
|---|
| ArgC ESI |
|
|---|
| LysN ESI |
|
|---|
| TryLysC ESI |
|
|---|
| Try MALDI |
|
|---|
| ChTry MALDI |
|
|---|
| ArgC MALDI |
|
|---|
| LysN MALDI |
|
|---|
| TryLysC MALDI |
|
|---|
| Try LTQ |
|
|---|
| ChTry LTQ |
|
|---|
| ArgC LTQ |
|
|---|
| LysN LTQ |
|
|---|
| TryLysC LTQ |
|
|---|
| Try MSlow |
|
|---|
| ChTry MSlow |
|
|---|
| ArgC MSlow |
|
|---|
| LysN MSlow |
|
|---|
| TryLysC MSlow |
|
|---|
| Try MShigh |
|
|---|
| ChTry MShigh |
|
|---|
| ArgC MShigh |
|
|---|
| LysN MShigh |
|
|---|
| TryLysC MShigh |
|
|---|
General Statistics
Number of major isoforms |
Number of additional isoforms |
Number of all proteins |
Number of amino acids |
Min. Seq. Length |
Max. Seq. Length |
Avg. Seq. Length |
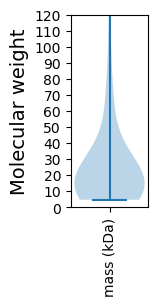
Avg. Mol. Weight |
|---|---|---|---|---|---|---|---|
0 |
23139 |
40 |
3272 |
238.5 |
26.37 |
Amino acid frequency
Ala |
Cys |
Asp |
Glu |
Phe |
Gly |
His |
Ile |
Lys |
Leu |
|---|---|---|---|---|---|---|---|---|---|
9.058 ± 0.799 | 0.985 ± 0.162 |
6.513 ± 0.459 | 6.422 ± 0.335 |
3.95 ± 0.13 | 7.662 ± 0.436 |
1.673 ± 0.173 | 5.804 ± 0.187 |
5.683 ± 0.253 | 7.36 ± 0.235 |
Met |
Asn |
Gln |
Pro |
Arg |
Ser |
Thr |
Val |
Trp |
Tyr |
|---|---|---|---|---|---|---|---|---|---|
2.818 ± 0.134 | 5.022 ± 0.18 |
4.819 ± 0.332 | 3.799 ± 0.216 |
5.087 ± 0.23 | 6.673 ± 0.276 |
5.744 ± 0.228 | 6.5 ± 0.222 |
1.5 ± 0.115 | 2.93 ± 0.183 |
Most of the basic statistics you can see at this page can be downloaded from this CSV file
See this proteome in:

Proteome-pI is available under Creative Commons Attribution-NoDerivs license, for more details see here
| Reference: Kozlowski LP. Proteome-pI 2.0: Proteome Isoelectric Point Database Update. Nucleic Acids Res. 2021, doi: 10.1093/nar/gkab944 | Contact: Lukasz P. Kozlowski |