Murine minute virus (strain MVM prototype) (MVM) (Murine minute virus (strain MVM(p)))
Taxonomy: Viruses; Monodnaviria; Shotokuvirae; Cossaviricota; Quintoviricetes; Piccovirales; Parvoviridae; Parvovirinae; Protoparvovirus; Rodent protoparvovirus 1; Minute virus of mice
Average proteome isoelectric point is 6.06
Get precalculated fractions of proteins

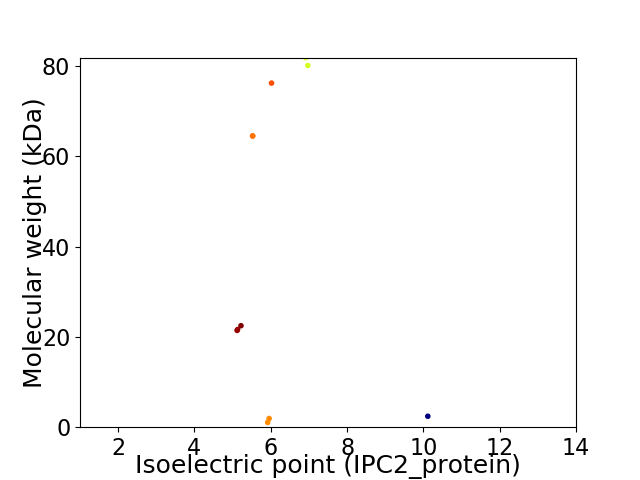
Virtual 2D-PAGE plot for 11 proteins (isoelectric point calculated using IPC2_protein)
Get csv file with sequences according to given criteria:
* You can choose from 21 different methods for calculating isoelectric point
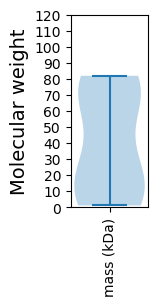
Summary statistics related to proteome-wise predictions


Protein with the lowest isoelectric point:
>tr|Q76W05|Q76W05_MUMIP Uncharacterized protein VP OS=Murine minute virus (strain MVM prototype) OX=648235 GN=VP PE=4 SV=1
MM1 pKa = 7.73AGNAYY6 pKa = 10.27SDD8 pKa = 4.01EE9 pKa = 4.3VLGATNWLKK18 pKa = 10.73EE19 pKa = 3.92KK20 pKa = 10.84SNQEE24 pKa = 3.58VFSFVFKK31 pKa = 11.24NEE33 pKa = 3.39NVQLNGKK40 pKa = 9.6DD41 pKa = 3.49IGWNSYY47 pKa = 10.08KK48 pKa = 10.4KK49 pKa = 10.12EE50 pKa = 3.99LQEE53 pKa = 5.82DD54 pKa = 4.14EE55 pKa = 5.18LKK57 pKa = 10.86SLQRR61 pKa = 11.84GAEE64 pKa = 4.29TTWDD68 pKa = 3.39QSEE71 pKa = 4.09DD72 pKa = 3.96MEE74 pKa = 4.61WEE76 pKa = 4.24TTVDD80 pKa = 3.15EE81 pKa = 4.3MTKK84 pKa = 10.62KK85 pKa = 10.64FGTLTIHH92 pKa = 6.55DD93 pKa = 4.13TEE95 pKa = 5.41KK96 pKa = 10.94YY97 pKa = 9.93ASQPEE102 pKa = 4.59LCTNSTCIGSRR113 pKa = 11.84GPGFRR118 pKa = 11.84ALEE121 pKa = 3.97HH122 pKa = 6.05TKK124 pKa = 10.49YY125 pKa = 10.51SCCGHH130 pKa = 6.26CRR132 pKa = 11.84NPEE135 pKa = 3.57HH136 pKa = 6.55WGSWFQSLPRR146 pKa = 11.84WSTEE150 pKa = 3.52PNLVRR155 pKa = 11.84DD156 pKa = 3.64RR157 pKa = 11.84GGFEE161 pKa = 3.84SVLRR165 pKa = 11.84CGTVEE170 pKa = 4.26EE171 pKa = 4.26RR172 pKa = 11.84LQRR175 pKa = 11.84AAEE178 pKa = 4.04LGLRR182 pKa = 11.84YY183 pKa = 10.33DD184 pKa = 4.2GASSS188 pKa = 3.15
MM1 pKa = 7.73AGNAYY6 pKa = 10.27SDD8 pKa = 4.01EE9 pKa = 4.3VLGATNWLKK18 pKa = 10.73EE19 pKa = 3.92KK20 pKa = 10.84SNQEE24 pKa = 3.58VFSFVFKK31 pKa = 11.24NEE33 pKa = 3.39NVQLNGKK40 pKa = 9.6DD41 pKa = 3.49IGWNSYY47 pKa = 10.08KK48 pKa = 10.4KK49 pKa = 10.12EE50 pKa = 3.99LQEE53 pKa = 5.82DD54 pKa = 4.14EE55 pKa = 5.18LKK57 pKa = 10.86SLQRR61 pKa = 11.84GAEE64 pKa = 4.29TTWDD68 pKa = 3.39QSEE71 pKa = 4.09DD72 pKa = 3.96MEE74 pKa = 4.61WEE76 pKa = 4.24TTVDD80 pKa = 3.15EE81 pKa = 4.3MTKK84 pKa = 10.62KK85 pKa = 10.64FGTLTIHH92 pKa = 6.55DD93 pKa = 4.13TEE95 pKa = 5.41KK96 pKa = 10.94YY97 pKa = 9.93ASQPEE102 pKa = 4.59LCTNSTCIGSRR113 pKa = 11.84GPGFRR118 pKa = 11.84ALEE121 pKa = 3.97HH122 pKa = 6.05TKK124 pKa = 10.49YY125 pKa = 10.51SCCGHH130 pKa = 6.26CRR132 pKa = 11.84NPEE135 pKa = 3.57HH136 pKa = 6.55WGSWFQSLPRR146 pKa = 11.84WSTEE150 pKa = 3.52PNLVRR155 pKa = 11.84DD156 pKa = 3.64RR157 pKa = 11.84GGFEE161 pKa = 3.84SVLRR165 pKa = 11.84CGTVEE170 pKa = 4.26EE171 pKa = 4.26RR172 pKa = 11.84LQRR175 pKa = 11.84AAEE178 pKa = 4.04LGLRR182 pKa = 11.84YY183 pKa = 10.33DD184 pKa = 4.2GASSS188 pKa = 3.15
Molecular weight: 21.45 kDa
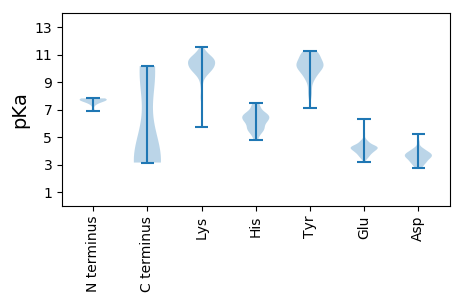
Isoelectric point according different methods:
Protein with the highest isoelectric point:
>tr|Q84367|Q84367_MUMIP VP1 protein OS=Murine minute virus (strain MVM prototype) OX=648235 GN=VP1 PE=1 SV=1
MM1 pKa = 7.68APPAKK6 pKa = 9.63RR7 pKa = 11.84AKK9 pKa = 9.84RR10 pKa = 11.84GKK12 pKa = 9.78GLRR15 pKa = 11.84DD16 pKa = 3.13GWLVGYY22 pKa = 10.16
MM1 pKa = 7.68APPAKK6 pKa = 9.63RR7 pKa = 11.84AKK9 pKa = 9.84RR10 pKa = 11.84GKK12 pKa = 9.78GLRR15 pKa = 11.84DD16 pKa = 3.13GWLVGYY22 pKa = 10.16
Molecular weight: 2.43 kDa
Isoelectric point according different methods:
Peptides (in silico digests for buttom-up proteomics)
Below you can find in silico digests of the whole proteome with Trypsin, Chymotrypsin, Trypsin+LysC, LysN, ArgC proteases suitable for different mass spec machines.| Try ESI |
 |
|---|
| ChTry ESI |
 |
|---|
| ArgC ESI |
 |
|---|
| LysN ESI |
 |
|---|
| TryLysC ESI |
 |
|---|
| Try MALDI |
 |
|---|
| ChTry MALDI |
 |
|---|
| ArgC MALDI |
 |
|---|
| LysN MALDI |
 |
|---|
| TryLysC MALDI |
 |
|---|
| Try LTQ |
 |
|---|
| ChTry LTQ |
 |
|---|
| ArgC LTQ |
 |
|---|
| LysN LTQ |
 |
|---|
| TryLysC LTQ |
 |
|---|
| Try MSlow |
 |
|---|
| ChTry MSlow |
 |
|---|
| ArgC MSlow |
 |
|---|
| LysN MSlow |
 |
|---|
| TryLysC MSlow |
 |
|---|
| Try MShigh |
 |
|---|
| ChTry MShigh |
 |
|---|
| ArgC MShigh |
 |
|---|
| LysN MShigh |
 |
|---|
| TryLysC MShigh |
 |
|---|
General Statistics
Number of major isoforms |
Number of additional isoforms |
Number of all proteins |
Number of amino acids |
Min. Seq. Length |
Max. Seq. Length |
Avg. Seq. Length |
Avg. Mol. Weight |
|---|---|---|---|---|---|---|---|
3914 |
9 |
729 |
355.8 |
39.85 |
Amino acid frequency
Ala |
Cys |
Asp |
Glu |
Phe |
Gly |
His |
Ile |
Lys |
Leu |
|---|---|---|---|---|---|---|---|---|---|
6.515 ± 0.47 | 1.788 ± 0.33 |
5.008 ± 0.195 | 6.055 ± 0.933 |
3.73 ± 0.144 | 7.971 ± 0.561 |
2.146 ± 0.139 | 3.628 ± 0.324 |
5.749 ± 0.867 | 7.128 ± 0.419 |
Met |
Asn |
Gln |
Pro |
Arg |
Ser |
Thr |
Val |
Trp |
Tyr |
|---|---|---|---|---|---|---|---|---|---|
2.146 ± 0.088 | 6.208 ± 0.208 |
5.416 ± 0.532 | 4.829 ± 0.104 |
4.318 ± 0.28 | 6.49 ± 0.263 |
8.712 ± 0.223 | 5.851 ± 0.238 |
3.117 ± 0.243 | 3.194 ± 0.36 |
Most of the basic statistics you can see at this page can be downloaded from this CSV file
Proteome-pI is available under Creative Commons Attribution-NoDerivs license, for more details see here
| Reference: Kozlowski LP. Proteome-pI 2.0: Proteome Isoelectric Point Database Update. Nucleic Acids Res. 2021, doi: 10.1093/nar/gkab944 | Contact: Lukasz P. Kozlowski |
