Roseovarius nanhaiticus
Taxonomy: cellular organisms; Bacteria; Proteobacteria; Alphaproteobacteria; Rhodobacterales; Roseobacteraceae; Roseovarius
Average proteome isoelectric point is 6.15
Get precalculated fractions of proteins

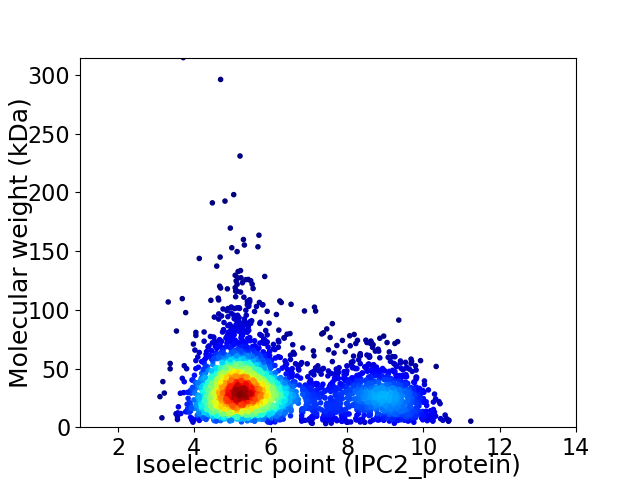
Virtual 2D-PAGE plot for 3516 proteins (isoelectric point calculated using IPC2_protein)
Get csv file with sequences according to given criteria:
* You can choose from 21 different methods for calculating isoelectric point
Summary statistics related to proteome-wise predictions


Protein with the lowest isoelectric point:
>tr|A0A1N7H195|A0A1N7H195_9RHOB Transcriptional regulator TetR family OS=Roseovarius nanhaiticus OX=573024 GN=SAMN05421666_2338 PE=4 SV=1
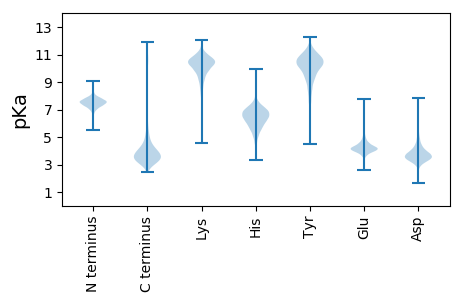
MM1 pKa = 7.64KK2 pKa = 10.25KK3 pKa = 9.84HH4 pKa = 6.23LLSTSAIALGTVALAAPAAAQEE26 pKa = 4.17WDD28 pKa = 3.48VSFGGFMSQHH38 pKa = 4.98VAYY41 pKa = 10.22ADD43 pKa = 3.75LSGSAVPAGSAQSLSAGDD61 pKa = 3.76FDD63 pKa = 5.7GVDD66 pKa = 2.72IHH68 pKa = 7.4SNSEE72 pKa = 4.04IIFTPSITLDD82 pKa = 3.03NGLTFGVNVQLEE94 pKa = 4.58TEE96 pKa = 4.16QNGAGEE102 pKa = 4.2IDD104 pKa = 3.82EE105 pKa = 5.03SYY107 pKa = 7.89MTISSDD113 pKa = 3.21TLGQIIIGSEE123 pKa = 3.39NSAGYY128 pKa = 10.45KK129 pKa = 10.5SMVGAPGVTSMYY141 pKa = 10.02INSPSISTFIPFSAAYY157 pKa = 9.35PGGFRR162 pKa = 11.84QAGLSSFTEE171 pKa = 4.07VAGNNDD177 pKa = 3.79VQRR180 pKa = 11.84LTYY183 pKa = 7.37FTPSFNGLTLGVSYY197 pKa = 11.2APTGNNNVANSFGVNKK213 pKa = 8.04NTPGVLSDD221 pKa = 3.61IFDD224 pKa = 3.37IGVNYY229 pKa = 10.44SQTFGTTSVTLSGRR243 pKa = 11.84YY244 pKa = 8.98GVGDD248 pKa = 3.58TNIAGVSDD256 pKa = 4.23PEE258 pKa = 3.98TWALGFQVGFADD270 pKa = 4.36FTFGGSYY277 pKa = 10.94AEE279 pKa = 4.36NDD281 pKa = 3.16NGVANGAGDD290 pKa = 3.52SSGYY294 pKa = 9.54SLGMTYY300 pKa = 10.49DD301 pKa = 3.06IAGPWAVEE309 pKa = 3.3ALAYY313 pKa = 9.83IGEE316 pKa = 4.4TDD318 pKa = 3.52VGASNADD325 pKa = 3.41YY326 pKa = 10.12EE327 pKa = 4.45AYY329 pKa = 10.39RR330 pKa = 11.84IGASRR335 pKa = 11.84DD336 pKa = 3.37LGPGVDD342 pKa = 2.92WDD344 pKa = 3.83IYY346 pKa = 10.43VVQLDD351 pKa = 3.89ADD353 pKa = 3.87NGGVGAANRR362 pKa = 11.84DD363 pKa = 3.31VSGTVIGTGINLSFF377 pKa = 4.55
MM1 pKa = 7.64KK2 pKa = 10.25KK3 pKa = 9.84HH4 pKa = 6.23LLSTSAIALGTVALAAPAAAQEE26 pKa = 4.17WDD28 pKa = 3.48VSFGGFMSQHH38 pKa = 4.98VAYY41 pKa = 10.22ADD43 pKa = 3.75LSGSAVPAGSAQSLSAGDD61 pKa = 3.76FDD63 pKa = 5.7GVDD66 pKa = 2.72IHH68 pKa = 7.4SNSEE72 pKa = 4.04IIFTPSITLDD82 pKa = 3.03NGLTFGVNVQLEE94 pKa = 4.58TEE96 pKa = 4.16QNGAGEE102 pKa = 4.2IDD104 pKa = 3.82EE105 pKa = 5.03SYY107 pKa = 7.89MTISSDD113 pKa = 3.21TLGQIIIGSEE123 pKa = 3.39NSAGYY128 pKa = 10.45KK129 pKa = 10.5SMVGAPGVTSMYY141 pKa = 10.02INSPSISTFIPFSAAYY157 pKa = 9.35PGGFRR162 pKa = 11.84QAGLSSFTEE171 pKa = 4.07VAGNNDD177 pKa = 3.79VQRR180 pKa = 11.84LTYY183 pKa = 7.37FTPSFNGLTLGVSYY197 pKa = 11.2APTGNNNVANSFGVNKK213 pKa = 8.04NTPGVLSDD221 pKa = 3.61IFDD224 pKa = 3.37IGVNYY229 pKa = 10.44SQTFGTTSVTLSGRR243 pKa = 11.84YY244 pKa = 8.98GVGDD248 pKa = 3.58TNIAGVSDD256 pKa = 4.23PEE258 pKa = 3.98TWALGFQVGFADD270 pKa = 4.36FTFGGSYY277 pKa = 10.94AEE279 pKa = 4.36NDD281 pKa = 3.16NGVANGAGDD290 pKa = 3.52SSGYY294 pKa = 9.54SLGMTYY300 pKa = 10.49DD301 pKa = 3.06IAGPWAVEE309 pKa = 3.3ALAYY313 pKa = 9.83IGEE316 pKa = 4.4TDD318 pKa = 3.52VGASNADD325 pKa = 3.41YY326 pKa = 10.12EE327 pKa = 4.45AYY329 pKa = 10.39RR330 pKa = 11.84IGASRR335 pKa = 11.84DD336 pKa = 3.37LGPGVDD342 pKa = 2.92WDD344 pKa = 3.83IYY346 pKa = 10.43VVQLDD351 pKa = 3.89ADD353 pKa = 3.87NGGVGAANRR362 pKa = 11.84DD363 pKa = 3.31VSGTVIGTGINLSFF377 pKa = 4.55
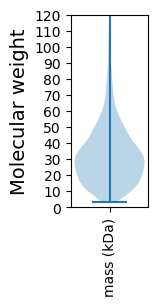
Molecular weight: 38.75 kDa
Isoelectric point according different methods:
Protein with the highest isoelectric point:
>tr|A0A1N7F4Y9|A0A1N7F4Y9_9RHOB Uncharacterized protein OS=Roseovarius nanhaiticus OX=573024 GN=SAMN05421666_0748 PE=4 SV=1
MM1 pKa = 7.45KK2 pKa = 9.61RR3 pKa = 11.84TFQPSNLVRR12 pKa = 11.84KK13 pKa = 9.18RR14 pKa = 11.84RR15 pKa = 11.84HH16 pKa = 4.42GFRR19 pKa = 11.84ARR21 pKa = 11.84MATKK25 pKa = 10.37AGRR28 pKa = 11.84KK29 pKa = 8.54ILNARR34 pKa = 11.84RR35 pKa = 11.84ARR37 pKa = 11.84GRR39 pKa = 11.84KK40 pKa = 9.07SLSAA44 pKa = 3.93
MM1 pKa = 7.45KK2 pKa = 9.61RR3 pKa = 11.84TFQPSNLVRR12 pKa = 11.84KK13 pKa = 9.18RR14 pKa = 11.84RR15 pKa = 11.84HH16 pKa = 4.42GFRR19 pKa = 11.84ARR21 pKa = 11.84MATKK25 pKa = 10.37AGRR28 pKa = 11.84KK29 pKa = 8.54ILNARR34 pKa = 11.84RR35 pKa = 11.84ARR37 pKa = 11.84GRR39 pKa = 11.84KK40 pKa = 9.07SLSAA44 pKa = 3.93
Molecular weight: 5.14 kDa
Isoelectric point according different methods:
Peptides (in silico digests for buttom-up proteomics)
Below you can find in silico digests of the whole proteome with Trypsin, Chymotrypsin, Trypsin+LysC, LysN, ArgC proteases suitable for different mass spec machines.| Try ESI |
 |
|---|
| ChTry ESI |
 |
|---|
| ArgC ESI |
 |
|---|
| LysN ESI |
 |
|---|
| TryLysC ESI |
 |
|---|
| Try MALDI |
 |
|---|
| ChTry MALDI |
 |
|---|
| ArgC MALDI |
 |
|---|
| LysN MALDI |
 |
|---|
| TryLysC MALDI |
 |
|---|
| Try LTQ |
 |
|---|
| ChTry LTQ |
 |
|---|
| ArgC LTQ |
 |
|---|
| LysN LTQ |
 |
|---|
| TryLysC LTQ |
 |
|---|
| Try MSlow |
 |
|---|
| ChTry MSlow |
 |
|---|
| ArgC MSlow |
 |
|---|
| LysN MSlow |
 |
|---|
| TryLysC MSlow |
 |
|---|
| Try MShigh |
 |
|---|
| ChTry MShigh |
 |
|---|
| ArgC MShigh |
 |
|---|
| LysN MShigh |
 |
|---|
| TryLysC MShigh |
 |
|---|
General Statistics
Number of major isoforms |
Number of additional isoforms |
Number of all proteins |
Number of amino acids |
Min. Seq. Length |
Max. Seq. Length |
Avg. Seq. Length |
Avg. Mol. Weight |
|---|---|---|---|---|---|---|---|
0 |
1111941 |
26 |
3015 |
316.3 |
34.21 |
Amino acid frequency
Ala |
Cys |
Asp |
Glu |
Phe |
Gly |
His |
Ile |
Lys |
Leu |
|---|---|---|---|---|---|---|---|---|---|
12.915 ± 0.059 | 0.895 ± 0.014 |
6.129 ± 0.036 | 5.81 ± 0.038 |
3.51 ± 0.026 | 8.947 ± 0.038 |
2.071 ± 0.021 | 5.337 ± 0.027 |
2.952 ± 0.038 | 9.939 ± 0.048 |
Met |
Asn |
Gln |
Pro |
Arg |
Ser |
Thr |
Val |
Trp |
Tyr |
|---|---|---|---|---|---|---|---|---|---|
2.958 ± 0.023 | 2.444 ± 0.022 |
5.104 ± 0.025 | 3.149 ± 0.023 |
6.841 ± 0.039 | 5.136 ± 0.027 |
5.376 ± 0.028 | 6.877 ± 0.034 |
1.386 ± 0.018 | 2.224 ± 0.019 |
Most of the basic statistics you can see at this page can be downloaded from this CSV file
Proteome-pI is available under Creative Commons Attribution-NoDerivs license, for more details see here
| Reference: Kozlowski LP. Proteome-pI 2.0: Proteome Isoelectric Point Database Update. Nucleic Acids Res. 2021, doi: 10.1093/nar/gkab944 | Contact: Lukasz P. Kozlowski |
