Actinomarinicola tropica
Taxonomy: cellular organisms; Bacteria; Terrabacteria group; Actinobacteria; Acidimicrobiia; Acidimicrobiales; Iamiaceae; Actinomarinicola
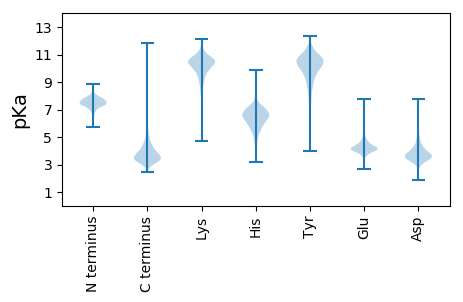
Average proteome isoelectric point is 5.73
Get precalculated fractions of proteins

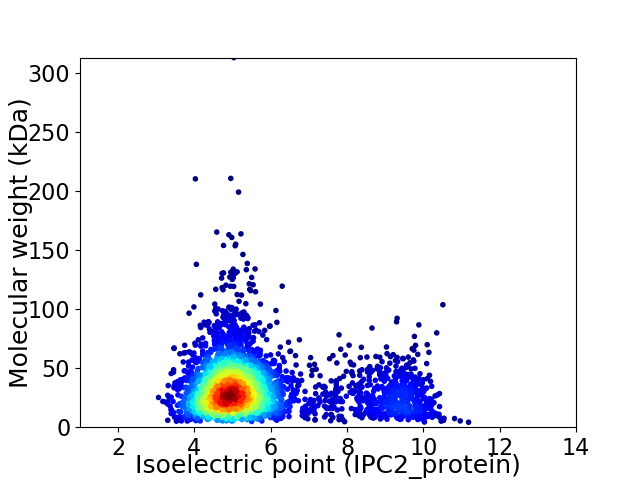
Virtual 2D-PAGE plot for 3559 proteins (isoelectric point calculated using IPC2_protein)
Get csv file with sequences according to given criteria:
* You can choose from 21 different methods for calculating isoelectric point
Summary statistics related to proteome-wise predictions


Protein with the lowest isoelectric point:
>tr|A0A5Q2RDX8|A0A5Q2RDX8_9ACTN (2R 3S)-2-methylisocitrate dehydratase OS=Actinomarinicola tropica OX=2789776 GN=GH723_08280 PE=4 SV=1
MM1 pKa = 7.47GGAADD6 pKa = 4.76DD7 pKa = 4.37GRR9 pKa = 11.84GGAPEE14 pKa = 4.32AVVEE18 pKa = 4.25LQPAEE23 pKa = 4.28PGRR26 pKa = 11.84GLPRR30 pKa = 11.84WAPTAIFAALVLLIGVVVAAQDD52 pKa = 3.86PGADD56 pKa = 4.74DD57 pKa = 5.27PGTDD61 pKa = 4.77DD62 pKa = 6.57DD63 pKa = 4.51LTEE66 pKa = 4.62DD67 pKa = 4.88LAFEE71 pKa = 4.95LDD73 pKa = 3.17GATAVGGPRR82 pKa = 11.84DD83 pKa = 3.7GLDD86 pKa = 3.31SLRR89 pKa = 11.84LPVQATPAQGLVDD102 pKa = 4.15GQTVTVSGSGFPPSRR117 pKa = 11.84NLGIVMCTPLGPSSIGGVDD136 pKa = 3.13NCQISPYY143 pKa = 9.67TAVTSDD149 pKa = 3.04AQGNFSAEE157 pKa = 4.15HH158 pKa = 5.5PVRR161 pKa = 11.84RR162 pKa = 11.84YY163 pKa = 7.79VTLANGVHH171 pKa = 7.22DD172 pKa = 4.77CAQAPPEE179 pKa = 4.71GSTHH183 pKa = 5.14TCVVAVGAIDD193 pKa = 5.98DD194 pKa = 4.12YY195 pKa = 11.53DD196 pKa = 3.7QSGTIGVHH204 pKa = 6.51FDD206 pKa = 3.43PDD208 pKa = 3.91VPGTPPLSIHH218 pKa = 6.7MDD220 pKa = 3.3PQGPVSVGDD229 pKa = 3.71TLTVTVEE236 pKa = 3.77NAAPGSSWWVDD247 pKa = 3.0VCGQGEE253 pKa = 4.48GGEE256 pKa = 4.25VDD258 pKa = 3.21QWGHH262 pKa = 4.77PTYY265 pKa = 11.15VSACASGAEE274 pKa = 4.41AYY276 pKa = 7.65TFCAVGGEE284 pKa = 4.21PACASPGGTEE294 pKa = 4.31VVAGPDD300 pKa = 3.36GTATFSLPAPASIAGADD317 pKa = 3.57GVVDD321 pKa = 4.07CRR323 pKa = 11.84SLTSFCEE330 pKa = 4.06VVVRR334 pKa = 11.84DD335 pKa = 3.43GDD337 pKa = 3.95TNGRR341 pKa = 11.84SFPVLLHH348 pKa = 6.03EE349 pKa = 4.74VADD352 pKa = 4.22ASSPPSTAVPPHH364 pKa = 5.42VTDD367 pKa = 3.29TTMSTEE373 pKa = 4.09TTTIGPDD380 pKa = 2.98EE381 pKa = 4.56GVTTEE386 pKa = 4.25TTVMPTTTVPGDD398 pKa = 3.22
MM1 pKa = 7.47GGAADD6 pKa = 4.76DD7 pKa = 4.37GRR9 pKa = 11.84GGAPEE14 pKa = 4.32AVVEE18 pKa = 4.25LQPAEE23 pKa = 4.28PGRR26 pKa = 11.84GLPRR30 pKa = 11.84WAPTAIFAALVLLIGVVVAAQDD52 pKa = 3.86PGADD56 pKa = 4.74DD57 pKa = 5.27PGTDD61 pKa = 4.77DD62 pKa = 6.57DD63 pKa = 4.51LTEE66 pKa = 4.62DD67 pKa = 4.88LAFEE71 pKa = 4.95LDD73 pKa = 3.17GATAVGGPRR82 pKa = 11.84DD83 pKa = 3.7GLDD86 pKa = 3.31SLRR89 pKa = 11.84LPVQATPAQGLVDD102 pKa = 4.15GQTVTVSGSGFPPSRR117 pKa = 11.84NLGIVMCTPLGPSSIGGVDD136 pKa = 3.13NCQISPYY143 pKa = 9.67TAVTSDD149 pKa = 3.04AQGNFSAEE157 pKa = 4.15HH158 pKa = 5.5PVRR161 pKa = 11.84RR162 pKa = 11.84YY163 pKa = 7.79VTLANGVHH171 pKa = 7.22DD172 pKa = 4.77CAQAPPEE179 pKa = 4.71GSTHH183 pKa = 5.14TCVVAVGAIDD193 pKa = 5.98DD194 pKa = 4.12YY195 pKa = 11.53DD196 pKa = 3.7QSGTIGVHH204 pKa = 6.51FDD206 pKa = 3.43PDD208 pKa = 3.91VPGTPPLSIHH218 pKa = 6.7MDD220 pKa = 3.3PQGPVSVGDD229 pKa = 3.71TLTVTVEE236 pKa = 3.77NAAPGSSWWVDD247 pKa = 3.0VCGQGEE253 pKa = 4.48GGEE256 pKa = 4.25VDD258 pKa = 3.21QWGHH262 pKa = 4.77PTYY265 pKa = 11.15VSACASGAEE274 pKa = 4.41AYY276 pKa = 7.65TFCAVGGEE284 pKa = 4.21PACASPGGTEE294 pKa = 4.31VVAGPDD300 pKa = 3.36GTATFSLPAPASIAGADD317 pKa = 3.57GVVDD321 pKa = 4.07CRR323 pKa = 11.84SLTSFCEE330 pKa = 4.06VVVRR334 pKa = 11.84DD335 pKa = 3.43GDD337 pKa = 3.95TNGRR341 pKa = 11.84SFPVLLHH348 pKa = 6.03EE349 pKa = 4.74VADD352 pKa = 4.22ASSPPSTAVPPHH364 pKa = 5.42VTDD367 pKa = 3.29TTMSTEE373 pKa = 4.09TTTIGPDD380 pKa = 2.98EE381 pKa = 4.56GVTTEE386 pKa = 4.25TTVMPTTTVPGDD398 pKa = 3.22
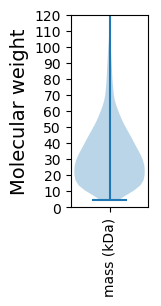
Molecular weight: 39.98 kDa
Isoelectric point according different methods:
Protein with the highest isoelectric point:
>tr|A0A5Q2RND4|A0A5Q2RND4_9ACTN Uncharacterized protein OS=Actinomarinicola tropica OX=2789776 GN=GH723_12920 PE=4 SV=1
MM1 pKa = 7.57GSLIKK6 pKa = 10.25KK7 pKa = 8.32RR8 pKa = 11.84RR9 pKa = 11.84KK10 pKa = 9.27RR11 pKa = 11.84MRR13 pKa = 11.84KK14 pKa = 8.3KK15 pKa = 10.03KK16 pKa = 9.06HH17 pKa = 5.6RR18 pKa = 11.84KK19 pKa = 5.5MLKK22 pKa = 7.83RR23 pKa = 11.84TRR25 pKa = 11.84FQRR28 pKa = 11.84RR29 pKa = 11.84AKK31 pKa = 10.52GKK33 pKa = 9.8
MM1 pKa = 7.57GSLIKK6 pKa = 10.25KK7 pKa = 8.32RR8 pKa = 11.84RR9 pKa = 11.84KK10 pKa = 9.27RR11 pKa = 11.84MRR13 pKa = 11.84KK14 pKa = 8.3KK15 pKa = 10.03KK16 pKa = 9.06HH17 pKa = 5.6RR18 pKa = 11.84KK19 pKa = 5.5MLKK22 pKa = 7.83RR23 pKa = 11.84TRR25 pKa = 11.84FQRR28 pKa = 11.84RR29 pKa = 11.84AKK31 pKa = 10.52GKK33 pKa = 9.8
Molecular weight: 4.22 kDa
Isoelectric point according different methods:
Peptides (in silico digests for buttom-up proteomics)
Below you can find in silico digests of the whole proteome with Trypsin, Chymotrypsin, Trypsin+LysC, LysN, ArgC proteases suitable for different mass spec machines.| Try ESI |
 |
|---|
| ChTry ESI |
 |
|---|
| ArgC ESI |
 |
|---|
| LysN ESI |
 |
|---|
| TryLysC ESI |
 |
|---|
| Try MALDI |
 |
|---|
| ChTry MALDI |
 |
|---|
| ArgC MALDI |
 |
|---|
| LysN MALDI |
 |
|---|
| TryLysC MALDI |
 |
|---|
| Try LTQ |
 |
|---|
| ChTry LTQ |
 |
|---|
| ArgC LTQ |
 |
|---|
| LysN LTQ |
 |
|---|
| TryLysC LTQ |
 |
|---|
| Try MSlow |
 |
|---|
| ChTry MSlow |
 |
|---|
| ArgC MSlow |
 |
|---|
| LysN MSlow |
 |
|---|
| TryLysC MSlow |
 |
|---|
| Try MShigh |
 |
|---|
| ChTry MShigh |
 |
|---|
| ArgC MShigh |
 |
|---|
| LysN MShigh |
 |
|---|
| TryLysC MShigh |
 |
|---|
General Statistics
Number of major isoforms |
Number of additional isoforms |
Number of all proteins |
Number of amino acids |
Min. Seq. Length |
Max. Seq. Length |
Avg. Seq. Length |
Avg. Mol. Weight |
|---|---|---|---|---|---|---|---|
0 |
1144291 |
33 |
2937 |
321.5 |
34.45 |
Amino acid frequency
Ala |
Cys |
Asp |
Glu |
Phe |
Gly |
His |
Ile |
Lys |
Leu |
|---|---|---|---|---|---|---|---|---|---|
13.251 ± 0.057 | 0.716 ± 0.012 |
7.074 ± 0.036 | 6.223 ± 0.039 |
2.703 ± 0.027 | 9.296 ± 0.036 |
2.358 ± 0.022 | 3.622 ± 0.023 |
1.335 ± 0.026 | 10.088 ± 0.047 |
Met |
Asn |
Gln |
Pro |
Arg |
Ser |
Thr |
Val |
Trp |
Tyr |
|---|---|---|---|---|---|---|---|---|---|
1.809 ± 0.02 | 1.507 ± 0.022 |
5.937 ± 0.03 | 2.391 ± 0.017 |
8.331 ± 0.048 | 4.86 ± 0.027 |
5.654 ± 0.029 | 9.668 ± 0.043 |
1.523 ± 0.015 | 1.654 ± 0.021 |
Most of the basic statistics you can see at this page can be downloaded from this CSV file
Proteome-pI is available under Creative Commons Attribution-NoDerivs license, for more details see here
| Reference: Kozlowski LP. Proteome-pI 2.0: Proteome Isoelectric Point Database Update. Nucleic Acids Res. 2021, doi: 10.1093/nar/gkab944 | Contact: Lukasz P. Kozlowski |
