Trichechus manatus latirostris papillomavirus 2
Taxonomy: Viruses; Monodnaviria; Shotokuvirae; Cossaviricota; Papovaviricetes; Zurhausenvirales; Papillomaviridae; Firstpapillomavirinae; Rhopapillomavirus; Rhopapillomavirus 1
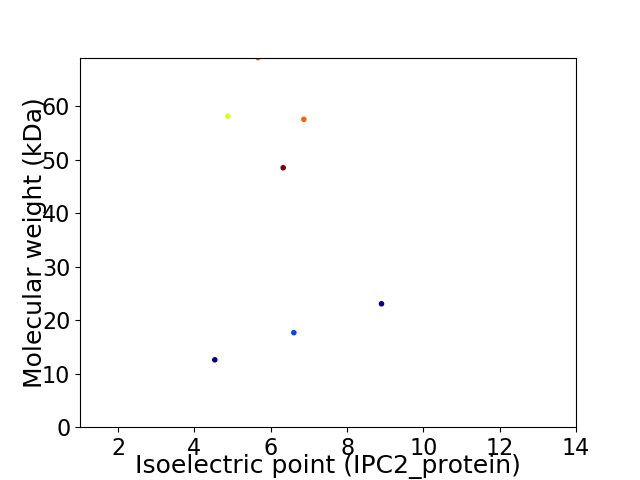
Average proteome isoelectric point is 6.2
Get precalculated fractions of proteins

Virtual 2D-PAGE plot for 7 proteins (isoelectric point calculated using IPC2_protein)
Get csv file with sequences according to given criteria:
* You can choose from 21 different methods for calculating isoelectric point
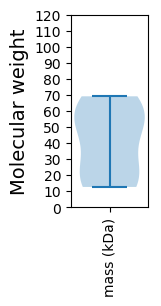
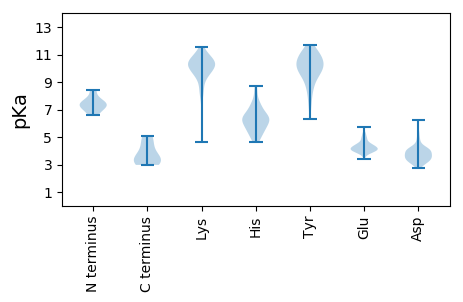
Summary statistics related to proteome-wise predictions


Protein with the lowest isoelectric point:
>tr|H6UYR4|H6UYR4_9PAPI Replication protein E1 OS=Trichechus manatus latirostris papillomavirus 2 OX=1144379 GN=E1 PE=3 SV=1
MM1 pKa = 7.56HH2 pKa = 7.66GEE4 pKa = 4.0TATVQDD10 pKa = 3.73VTLDD14 pKa = 4.06LSPLTIPTPDD24 pKa = 2.77VDD26 pKa = 4.34LRR28 pKa = 11.84CEE30 pKa = 3.98EE31 pKa = 4.39TVDD34 pKa = 3.97FTGVDD39 pKa = 3.3WTAVCVLQNEE49 pKa = 4.87KK50 pKa = 10.19ILQEE54 pKa = 3.96EE55 pKa = 4.05LGARR59 pKa = 11.84IGKK62 pKa = 9.66AYY64 pKa = 9.6KK65 pKa = 9.85IQAEE69 pKa = 4.32CGQCGVGVCACFLATHH85 pKa = 6.57EE86 pKa = 5.21GIVGLEE92 pKa = 3.56RR93 pKa = 11.84LLFDD97 pKa = 5.21DD98 pKa = 6.21VYY100 pKa = 10.48FLCYY104 pKa = 10.57GCGTAIKK111 pKa = 8.89YY112 pKa = 9.17HH113 pKa = 6.49HH114 pKa = 6.98GGG116 pKa = 3.31
MM1 pKa = 7.56HH2 pKa = 7.66GEE4 pKa = 4.0TATVQDD10 pKa = 3.73VTLDD14 pKa = 4.06LSPLTIPTPDD24 pKa = 2.77VDD26 pKa = 4.34LRR28 pKa = 11.84CEE30 pKa = 3.98EE31 pKa = 4.39TVDD34 pKa = 3.97FTGVDD39 pKa = 3.3WTAVCVLQNEE49 pKa = 4.87KK50 pKa = 10.19ILQEE54 pKa = 3.96EE55 pKa = 4.05LGARR59 pKa = 11.84IGKK62 pKa = 9.66AYY64 pKa = 9.6KK65 pKa = 9.85IQAEE69 pKa = 4.32CGQCGVGVCACFLATHH85 pKa = 6.57EE86 pKa = 5.21GIVGLEE92 pKa = 3.56RR93 pKa = 11.84LLFDD97 pKa = 5.21DD98 pKa = 6.21VYY100 pKa = 10.48FLCYY104 pKa = 10.57GCGTAIKK111 pKa = 8.89YY112 pKa = 9.17HH113 pKa = 6.49HH114 pKa = 6.98GGG116 pKa = 3.31
Molecular weight: 12.6 kDa
Isoelectric point according different methods:
Protein with the highest isoelectric point:
>tr|H6UYR6|H6UYR6_9PAPI E4 OS=Trichechus manatus latirostris papillomavirus 2 OX=1144379 GN=E4 PE=4 SV=1
MM1 pKa = 7.1CQSGKK6 pKa = 10.27KK7 pKa = 9.53PPGVQTFGAATTMKK21 pKa = 10.15GPQRR25 pKa = 11.84LTILHH30 pKa = 6.29LWKK33 pKa = 10.17RR34 pKa = 11.84PSGMDD39 pKa = 2.79IRR41 pKa = 11.84VCGKK45 pKa = 9.72YY46 pKa = 9.95IRR48 pKa = 11.84TLRR51 pKa = 11.84LIPVPPPQTLLLATATGPPSQTARR75 pKa = 11.84HH76 pKa = 5.86RR77 pKa = 11.84RR78 pKa = 11.84PPPTGLPTDD87 pKa = 4.02PQPAEE92 pKa = 4.62GPPPTYY98 pKa = 7.65PTPQLPDD105 pKa = 5.29AIPKK109 pKa = 10.23RR110 pKa = 11.84MQQPNLGATAALPAYY125 pKa = 10.11LLGAGPFQAHH135 pKa = 6.2RR136 pKa = 11.84RR137 pKa = 11.84NPLLAQVVYY146 pKa = 10.81ALVAAEE152 pKa = 4.82LPGEE156 pKa = 4.22TASLGPFPEE165 pKa = 4.62EE166 pKa = 4.27SDD168 pKa = 3.32PGTPEE173 pKa = 4.07DD174 pKa = 4.0TLKK177 pKa = 11.25DD178 pKa = 3.7LLKK181 pKa = 10.78DD182 pKa = 3.11ILRR185 pKa = 11.84RR186 pKa = 11.84WGGDD190 pKa = 3.23LEE192 pKa = 4.37RR193 pKa = 11.84LVEE196 pKa = 4.15NVSLAVLWYY205 pKa = 10.53LRR207 pKa = 11.84TVDD210 pKa = 4.01NSPP213 pKa = 3.27
MM1 pKa = 7.1CQSGKK6 pKa = 10.27KK7 pKa = 9.53PPGVQTFGAATTMKK21 pKa = 10.15GPQRR25 pKa = 11.84LTILHH30 pKa = 6.29LWKK33 pKa = 10.17RR34 pKa = 11.84PSGMDD39 pKa = 2.79IRR41 pKa = 11.84VCGKK45 pKa = 9.72YY46 pKa = 9.95IRR48 pKa = 11.84TLRR51 pKa = 11.84LIPVPPPQTLLLATATGPPSQTARR75 pKa = 11.84HH76 pKa = 5.86RR77 pKa = 11.84RR78 pKa = 11.84PPPTGLPTDD87 pKa = 4.02PQPAEE92 pKa = 4.62GPPPTYY98 pKa = 7.65PTPQLPDD105 pKa = 5.29AIPKK109 pKa = 10.23RR110 pKa = 11.84MQQPNLGATAALPAYY125 pKa = 10.11LLGAGPFQAHH135 pKa = 6.2RR136 pKa = 11.84RR137 pKa = 11.84NPLLAQVVYY146 pKa = 10.81ALVAAEE152 pKa = 4.82LPGEE156 pKa = 4.22TASLGPFPEE165 pKa = 4.62EE166 pKa = 4.27SDD168 pKa = 3.32PGTPEE173 pKa = 4.07DD174 pKa = 4.0TLKK177 pKa = 11.25DD178 pKa = 3.7LLKK181 pKa = 10.78DD182 pKa = 3.11ILRR185 pKa = 11.84RR186 pKa = 11.84WGGDD190 pKa = 3.23LEE192 pKa = 4.37RR193 pKa = 11.84LVEE196 pKa = 4.15NVSLAVLWYY205 pKa = 10.53LRR207 pKa = 11.84TVDD210 pKa = 4.01NSPP213 pKa = 3.27
Molecular weight: 23.07 kDa
Isoelectric point according different methods:
Peptides (in silico digests for buttom-up proteomics)
Below you can find in silico digests of the whole proteome with Trypsin, Chymotrypsin, Trypsin+LysC, LysN, ArgC proteases suitable for different mass spec machines.| Try ESI |
 |
|---|
| ChTry ESI |
 |
|---|
| ArgC ESI |
 |
|---|
| LysN ESI |
 |
|---|
| TryLysC ESI |
 |
|---|
| Try MALDI |
 |
|---|
| ChTry MALDI |
 |
|---|
| ArgC MALDI |
 |
|---|
| LysN MALDI |
 |
|---|
| TryLysC MALDI |
 |
|---|
| Try LTQ |
 |
|---|
| ChTry LTQ |
 |
|---|
| ArgC LTQ |
 |
|---|
| LysN LTQ |
 |
|---|
| TryLysC LTQ |
 |
|---|
| Try MSlow |
 |
|---|
| ChTry MSlow |
 |
|---|
| ArgC MSlow |
 |
|---|
| LysN MSlow |
 |
|---|
| TryLysC MSlow |
 |
|---|
| Try MShigh |
 |
|---|
| ChTry MShigh |
 |
|---|
| ArgC MShigh |
 |
|---|
| LysN MShigh |
 |
|---|
| TryLysC MShigh |
 |
|---|
General Statistics
Number of major isoforms |
Number of additional isoforms |
Number of all proteins |
Number of amino acids |
Min. Seq. Length |
Max. Seq. Length |
Avg. Seq. Length |
Avg. Mol. Weight |
|---|---|---|---|---|---|---|---|
0 |
2581 |
116 |
615 |
368.7 |
40.95 |
Amino acid frequency
Ala |
Cys |
Asp |
Glu |
Phe |
Gly |
His |
Ile |
Lys |
Leu |
|---|---|---|---|---|---|---|---|---|---|
7.71 ± 0.619 | 2.441 ± 0.721 |
6.005 ± 0.413 | 6.122 ± 0.527 |
3.565 ± 0.431 | 7.788 ± 0.677 |
2.286 ± 0.185 | 4.339 ± 0.593 |
3.952 ± 0.797 | 8.485 ± 0.769 |
Met |
Asn |
Gln |
Pro |
Arg |
Ser |
Thr |
Val |
Trp |
Tyr |
|---|---|---|---|---|---|---|---|---|---|
1.782 ± 0.388 | 3.138 ± 0.531 |
7.245 ± 1.368 | 4.146 ± 0.491 |
6.858 ± 0.297 | 6.005 ± 0.999 |
7.478 ± 0.707 | 5.773 ± 0.45 |
1.472 ± 0.277 | 3.41 ± 0.337 |
Most of the basic statistics you can see at this page can be downloaded from this CSV file
Proteome-pI is available under Creative Commons Attribution-NoDerivs license, for more details see here
| Reference: Kozlowski LP. Proteome-pI 2.0: Proteome Isoelectric Point Database Update. Nucleic Acids Res. 2021, doi: 10.1093/nar/gkab944 | Contact: Lukasz P. Kozlowski |
