Roseovarius mucosus DSM 17069
Taxonomy: cellular organisms; Bacteria; Proteobacteria; Alphaproteobacteria; Rhodobacterales; Roseobacteraceae; Roseovarius; Roseovarius mucosus
Average proteome isoelectric point is 6.27
Get precalculated fractions of proteins

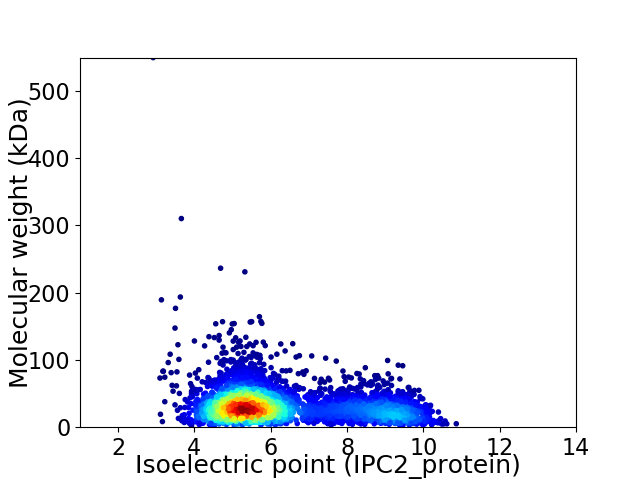
Virtual 2D-PAGE plot for 4182 proteins (isoelectric point calculated using IPC2_protein)
Get csv file with sequences according to given criteria:
* You can choose from 21 different methods for calculating isoelectric point
Summary statistics related to proteome-wise predictions


Protein with the lowest isoelectric point:
>tr|A0A0A0HPA4|A0A0A0HPA4_9RHOB Uncharacterized protein OS=Roseovarius mucosus DSM 17069 OX=1288298 GN=rosmuc_02597 PE=4 SV=1
MM1 pKa = 7.5SFKK4 pKa = 8.72TTFALTTVAVSLGAAAQGDD23 pKa = 3.94DD24 pKa = 3.26HH25 pKa = 6.13VTLRR29 pKa = 11.84GYY31 pKa = 11.21ALAADD36 pKa = 4.74GGTLVTMADD45 pKa = 4.02LSQPGAVEE53 pKa = 4.72TYY55 pKa = 11.37ALATPLRR62 pKa = 11.84AIAYY66 pKa = 9.19RR67 pKa = 11.84PVTGQLLGYY76 pKa = 9.94SDD78 pKa = 4.12GAIFAVDD85 pKa = 3.87PEE87 pKa = 4.61SGQLTDD93 pKa = 4.66LGATFMEE100 pKa = 4.9DD101 pKa = 3.09AVIGEE106 pKa = 4.39GAVAFDD112 pKa = 4.7FNNQIDD118 pKa = 3.77AVRR121 pKa = 11.84AVGADD126 pKa = 3.4GSNLVYY132 pKa = 10.26FPQGFGDD139 pKa = 3.35NDD141 pKa = 3.03EE142 pKa = 4.67RR143 pKa = 11.84ANSVRR148 pKa = 11.84RR149 pKa = 11.84FTDD152 pKa = 2.93AFYY155 pKa = 11.22VAGDD159 pKa = 3.69MSAGSDD165 pKa = 3.24PVIFANAYY173 pKa = 7.4TNAIPGAKK181 pKa = 9.59AASTAQYY188 pKa = 11.3ALDD191 pKa = 4.28AGADD195 pKa = 3.72ALVTLANNAGEE206 pKa = 4.13LASVGHH212 pKa = 6.92LSLDD216 pKa = 3.49GATVDD221 pKa = 3.5VSDD224 pKa = 3.69WGGFDD229 pKa = 2.72IVSPEE234 pKa = 4.13EE235 pKa = 4.29GTDD238 pKa = 3.09MAYY241 pKa = 10.21AILQIEE247 pKa = 4.49GAEE250 pKa = 4.21TAGLYY255 pKa = 10.62SVDD258 pKa = 4.32LGSGALTEE266 pKa = 4.17MADD269 pKa = 3.35LGMGGFTGFAVAQAQQ284 pKa = 3.27
MM1 pKa = 7.5SFKK4 pKa = 8.72TTFALTTVAVSLGAAAQGDD23 pKa = 3.94DD24 pKa = 3.26HH25 pKa = 6.13VTLRR29 pKa = 11.84GYY31 pKa = 11.21ALAADD36 pKa = 4.74GGTLVTMADD45 pKa = 4.02LSQPGAVEE53 pKa = 4.72TYY55 pKa = 11.37ALATPLRR62 pKa = 11.84AIAYY66 pKa = 9.19RR67 pKa = 11.84PVTGQLLGYY76 pKa = 9.94SDD78 pKa = 4.12GAIFAVDD85 pKa = 3.87PEE87 pKa = 4.61SGQLTDD93 pKa = 4.66LGATFMEE100 pKa = 4.9DD101 pKa = 3.09AVIGEE106 pKa = 4.39GAVAFDD112 pKa = 4.7FNNQIDD118 pKa = 3.77AVRR121 pKa = 11.84AVGADD126 pKa = 3.4GSNLVYY132 pKa = 10.26FPQGFGDD139 pKa = 3.35NDD141 pKa = 3.03EE142 pKa = 4.67RR143 pKa = 11.84ANSVRR148 pKa = 11.84RR149 pKa = 11.84FTDD152 pKa = 2.93AFYY155 pKa = 11.22VAGDD159 pKa = 3.69MSAGSDD165 pKa = 3.24PVIFANAYY173 pKa = 7.4TNAIPGAKK181 pKa = 9.59AASTAQYY188 pKa = 11.3ALDD191 pKa = 4.28AGADD195 pKa = 3.72ALVTLANNAGEE206 pKa = 4.13LASVGHH212 pKa = 6.92LSLDD216 pKa = 3.49GATVDD221 pKa = 3.5VSDD224 pKa = 3.69WGGFDD229 pKa = 2.72IVSPEE234 pKa = 4.13EE235 pKa = 4.29GTDD238 pKa = 3.09MAYY241 pKa = 10.21AILQIEE247 pKa = 4.49GAEE250 pKa = 4.21TAGLYY255 pKa = 10.62SVDD258 pKa = 4.32LGSGALTEE266 pKa = 4.17MADD269 pKa = 3.35LGMGGFTGFAVAQAQQ284 pKa = 3.27
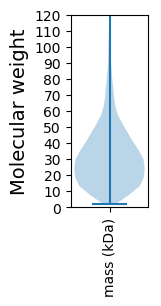
Molecular weight: 28.87 kDa
Isoelectric point according different methods:
Protein with the highest isoelectric point:
>tr|A0A0A0HND4|A0A0A0HND4_9RHOB Iron-regulated ABC transporter permease protein SufD OS=Roseovarius mucosus DSM 17069 OX=1288298 GN=rosmuc_01557 PE=3 SV=1
MM1 pKa = 7.45KK2 pKa = 9.61RR3 pKa = 11.84TFQPSNLVRR12 pKa = 11.84KK13 pKa = 8.83HH14 pKa = 4.64RR15 pKa = 11.84HH16 pKa = 3.91GFRR19 pKa = 11.84ARR21 pKa = 11.84MATKK25 pKa = 10.37AGRR28 pKa = 11.84KK29 pKa = 8.54ILNARR34 pKa = 11.84RR35 pKa = 11.84ARR37 pKa = 11.84GRR39 pKa = 11.84KK40 pKa = 8.57SLCAA44 pKa = 3.82
MM1 pKa = 7.45KK2 pKa = 9.61RR3 pKa = 11.84TFQPSNLVRR12 pKa = 11.84KK13 pKa = 8.83HH14 pKa = 4.64RR15 pKa = 11.84HH16 pKa = 3.91GFRR19 pKa = 11.84ARR21 pKa = 11.84MATKK25 pKa = 10.37AGRR28 pKa = 11.84KK29 pKa = 8.54ILNARR34 pKa = 11.84RR35 pKa = 11.84ARR37 pKa = 11.84GRR39 pKa = 11.84KK40 pKa = 8.57SLCAA44 pKa = 3.82
Molecular weight: 5.13 kDa
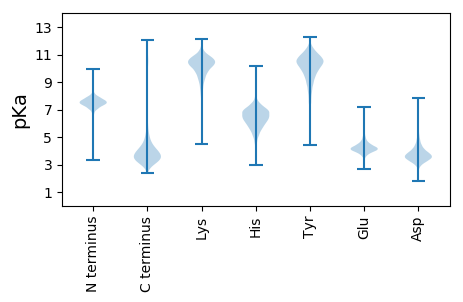
Isoelectric point according different methods:
Peptides (in silico digests for buttom-up proteomics)
Below you can find in silico digests of the whole proteome with Trypsin, Chymotrypsin, Trypsin+LysC, LysN, ArgC proteases suitable for different mass spec machines.| Try ESI |
 |
|---|
| ChTry ESI |
 |
|---|
| ArgC ESI |
 |
|---|
| LysN ESI |
 |
|---|
| TryLysC ESI |
 |
|---|
| Try MALDI |
 |
|---|
| ChTry MALDI |
 |
|---|
| ArgC MALDI |
 |
|---|
| LysN MALDI |
 |
|---|
| TryLysC MALDI |
 |
|---|
| Try LTQ |
 |
|---|
| ChTry LTQ |
 |
|---|
| ArgC LTQ |
 |
|---|
| LysN LTQ |
 |
|---|
| TryLysC LTQ |
 |
|---|
| Try MSlow |
 |
|---|
| ChTry MSlow |
 |
|---|
| ArgC MSlow |
 |
|---|
| LysN MSlow |
 |
|---|
| TryLysC MSlow |
 |
|---|
| Try MShigh |
 |
|---|
| ChTry MShigh |
 |
|---|
| ArgC MShigh |
 |
|---|
| LysN MShigh |
 |
|---|
| TryLysC MShigh |
 |
|---|
General Statistics
Number of major isoforms |
Number of additional isoforms |
Number of all proteins |
Number of amino acids |
Min. Seq. Length |
Max. Seq. Length |
Avg. Seq. Length |
Avg. Mol. Weight |
|---|---|---|---|---|---|---|---|
0 |
1286318 |
20 |
5490 |
307.6 |
33.36 |
Amino acid frequency
Ala |
Cys |
Asp |
Glu |
Phe |
Gly |
His |
Ile |
Lys |
Leu |
|---|---|---|---|---|---|---|---|---|---|
12.587 ± 0.05 | 0.918 ± 0.013 |
5.932 ± 0.04 | 5.823 ± 0.033 |
3.621 ± 0.023 | 8.789 ± 0.047 |
2.115 ± 0.02 | 5.111 ± 0.027 |
2.853 ± 0.036 | 10.257 ± 0.052 |
Met |
Asn |
Gln |
Pro |
Arg |
Ser |
Thr |
Val |
Trp |
Tyr |
|---|---|---|---|---|---|---|---|---|---|
2.791 ± 0.022 | 2.527 ± 0.023 |
5.111 ± 0.028 | 3.207 ± 0.02 |
7.013 ± 0.048 | 4.967 ± 0.026 |
5.533 ± 0.051 | 7.256 ± 0.033 |
1.395 ± 0.017 | 2.193 ± 0.02 |
Most of the basic statistics you can see at this page can be downloaded from this CSV file
Proteome-pI is available under Creative Commons Attribution-NoDerivs license, for more details see here
| Reference: Kozlowski LP. Proteome-pI 2.0: Proteome Isoelectric Point Database Update. Nucleic Acids Res. 2021, doi: 10.1093/nar/gkab944 | Contact: Lukasz P. Kozlowski |
