Gordonia paraffinivorans NBRC 108238
Taxonomy: cellular organisms; Bacteria; Terrabacteria group; Actinobacteria; Actinomycetia; Corynebacteriales; Gordoniaceae; Gordonia; Gordonia paraffinivorans
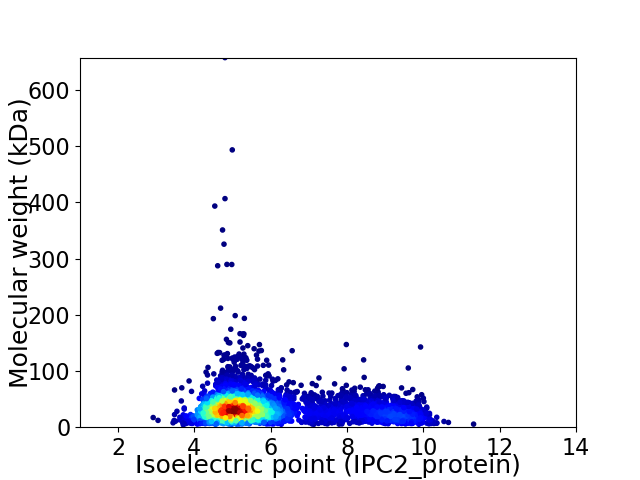
Average proteome isoelectric point is 5.9
Get precalculated fractions of proteins

Virtual 2D-PAGE plot for 4191 proteins (isoelectric point calculated using IPC2_protein)
Get csv file with sequences according to given criteria:
* You can choose from 21 different methods for calculating isoelectric point
Summary statistics related to proteome-wise predictions


Protein with the lowest isoelectric point:
>tr|M3VHV4|M3VHV4_9ACTN Putative acyl-CoA carboxylase beta chain OS=Gordonia paraffinivorans NBRC 108238 OX=1223543 GN=GP2_003_01070 PE=3 SV=1
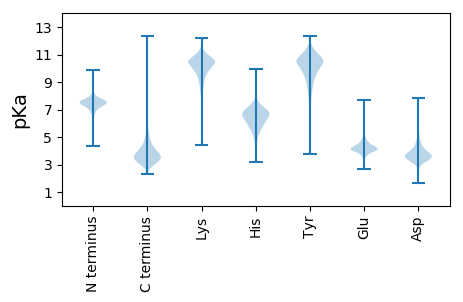
MM1 pKa = 7.64GSPYY5 pKa = 10.79DD6 pKa = 4.01PNQPTQMGPQGGQQPGWPGPQPGAGGPGFGAQPGQPYY43 pKa = 9.87AQQPYY48 pKa = 7.81GQQYY52 pKa = 9.3PPQPGQQPYY61 pKa = 8.91GQQPYY66 pKa = 9.08GQQPYY71 pKa = 9.77GPPPQPPSSSGGGKK85 pKa = 9.26KK86 pKa = 7.25WWFIGGGGVLLILIVVVAVVLAFTLGGGDD115 pKa = 5.09DD116 pKa = 4.28EE117 pKa = 6.19PDD119 pKa = 3.43VPTASAVDD127 pKa = 3.53MLLPEE132 pKa = 4.81SEE134 pKa = 4.65FPDD137 pKa = 3.07ITGEE141 pKa = 4.17FEE143 pKa = 5.59LDD145 pKa = 3.27TAQSGDD151 pKa = 4.01DD152 pKa = 4.33DD153 pKa = 5.95DD154 pKa = 6.5ISVDD158 pKa = 3.45NEE160 pKa = 3.54KK161 pKa = 10.55CARR164 pKa = 11.84LVDD167 pKa = 4.1SQSGGDD173 pKa = 3.53YY174 pKa = 10.59AQRR177 pKa = 11.84EE178 pKa = 4.47LTEE181 pKa = 4.4TPSSGEE187 pKa = 3.67IFFGLDD193 pKa = 2.78AYY195 pKa = 10.7SAEE198 pKa = 4.31VTKK201 pKa = 10.24PADD204 pKa = 3.45DD205 pKa = 4.2TYY207 pKa = 11.6DD208 pKa = 3.35TFDD211 pKa = 4.76DD212 pKa = 3.93VLAACSSFTLTLKK225 pKa = 10.79DD226 pKa = 3.92DD227 pKa = 4.33GGDD230 pKa = 3.08IPVAVKK236 pKa = 10.61LEE238 pKa = 4.14KK239 pKa = 10.36ADD241 pKa = 4.46LPIDD245 pKa = 3.9SNYY248 pKa = 10.57KK249 pKa = 8.59AFNMFGEE256 pKa = 4.3FSIDD260 pKa = 3.28AAGDD264 pKa = 3.62EE265 pKa = 4.55VEE267 pKa = 4.66VYY269 pKa = 10.7QIGTYY274 pKa = 10.45VYY276 pKa = 9.42GEE278 pKa = 3.94EE279 pKa = 4.11RR280 pKa = 11.84GVSFGVGYY288 pKa = 11.0NSFSDD293 pKa = 3.51EE294 pKa = 4.15KK295 pKa = 11.17LSVDD299 pKa = 3.88SQIEE303 pKa = 4.24NNLSQMFAKK312 pKa = 9.83QHH314 pKa = 4.82QRR316 pKa = 11.84IKK318 pKa = 10.81DD319 pKa = 3.44ASS321 pKa = 3.42
MM1 pKa = 7.64GSPYY5 pKa = 10.79DD6 pKa = 4.01PNQPTQMGPQGGQQPGWPGPQPGAGGPGFGAQPGQPYY43 pKa = 9.87AQQPYY48 pKa = 7.81GQQYY52 pKa = 9.3PPQPGQQPYY61 pKa = 8.91GQQPYY66 pKa = 9.08GQQPYY71 pKa = 9.77GPPPQPPSSSGGGKK85 pKa = 9.26KK86 pKa = 7.25WWFIGGGGVLLILIVVVAVVLAFTLGGGDD115 pKa = 5.09DD116 pKa = 4.28EE117 pKa = 6.19PDD119 pKa = 3.43VPTASAVDD127 pKa = 3.53MLLPEE132 pKa = 4.81SEE134 pKa = 4.65FPDD137 pKa = 3.07ITGEE141 pKa = 4.17FEE143 pKa = 5.59LDD145 pKa = 3.27TAQSGDD151 pKa = 4.01DD152 pKa = 4.33DD153 pKa = 5.95DD154 pKa = 6.5ISVDD158 pKa = 3.45NEE160 pKa = 3.54KK161 pKa = 10.55CARR164 pKa = 11.84LVDD167 pKa = 4.1SQSGGDD173 pKa = 3.53YY174 pKa = 10.59AQRR177 pKa = 11.84EE178 pKa = 4.47LTEE181 pKa = 4.4TPSSGEE187 pKa = 3.67IFFGLDD193 pKa = 2.78AYY195 pKa = 10.7SAEE198 pKa = 4.31VTKK201 pKa = 10.24PADD204 pKa = 3.45DD205 pKa = 4.2TYY207 pKa = 11.6DD208 pKa = 3.35TFDD211 pKa = 4.76DD212 pKa = 3.93VLAACSSFTLTLKK225 pKa = 10.79DD226 pKa = 3.92DD227 pKa = 4.33GGDD230 pKa = 3.08IPVAVKK236 pKa = 10.61LEE238 pKa = 4.14KK239 pKa = 10.36ADD241 pKa = 4.46LPIDD245 pKa = 3.9SNYY248 pKa = 10.57KK249 pKa = 8.59AFNMFGEE256 pKa = 4.3FSIDD260 pKa = 3.28AAGDD264 pKa = 3.62EE265 pKa = 4.55VEE267 pKa = 4.66VYY269 pKa = 10.7QIGTYY274 pKa = 10.45VYY276 pKa = 9.42GEE278 pKa = 3.94EE279 pKa = 4.11RR280 pKa = 11.84GVSFGVGYY288 pKa = 11.0NSFSDD293 pKa = 3.51EE294 pKa = 4.15KK295 pKa = 11.17LSVDD299 pKa = 3.88SQIEE303 pKa = 4.24NNLSQMFAKK312 pKa = 9.83QHH314 pKa = 4.82QRR316 pKa = 11.84IKK318 pKa = 10.81DD319 pKa = 3.44ASS321 pKa = 3.42
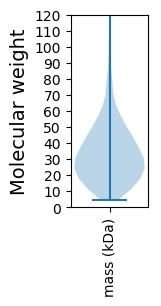
Molecular weight: 34.18 kDa
Isoelectric point according different methods:
Protein with the highest isoelectric point:
>tr|M3VEE9|M3VEE9_9ACTN Putative LuxR family transcriptional regulator OS=Gordonia paraffinivorans NBRC 108238 OX=1223543 GN=GP2_017_00970 PE=4 SV=1
MM1 pKa = 7.69AKK3 pKa = 10.06GKK5 pKa = 8.69RR6 pKa = 11.84TFQPNNRR13 pKa = 11.84RR14 pKa = 11.84RR15 pKa = 11.84ARR17 pKa = 11.84KK18 pKa = 8.65HH19 pKa = 4.47GFRR22 pKa = 11.84LRR24 pKa = 11.84MRR26 pKa = 11.84TRR28 pKa = 11.84AGRR31 pKa = 11.84AIVSARR37 pKa = 11.84RR38 pKa = 11.84SKK40 pKa = 10.79GRR42 pKa = 11.84AKK44 pKa = 9.67LTAA47 pKa = 4.21
MM1 pKa = 7.69AKK3 pKa = 10.06GKK5 pKa = 8.69RR6 pKa = 11.84TFQPNNRR13 pKa = 11.84RR14 pKa = 11.84RR15 pKa = 11.84ARR17 pKa = 11.84KK18 pKa = 8.65HH19 pKa = 4.47GFRR22 pKa = 11.84LRR24 pKa = 11.84MRR26 pKa = 11.84TRR28 pKa = 11.84AGRR31 pKa = 11.84AIVSARR37 pKa = 11.84RR38 pKa = 11.84SKK40 pKa = 10.79GRR42 pKa = 11.84AKK44 pKa = 9.67LTAA47 pKa = 4.21
Molecular weight: 5.48 kDa
Isoelectric point according different methods:
Peptides (in silico digests for buttom-up proteomics)
Below you can find in silico digests of the whole proteome with Trypsin, Chymotrypsin, Trypsin+LysC, LysN, ArgC proteases suitable for different mass spec machines.| Try ESI |
 |
|---|
| ChTry ESI |
 |
|---|
| ArgC ESI |
 |
|---|
| LysN ESI |
 |
|---|
| TryLysC ESI |
 |
|---|
| Try MALDI |
 |
|---|
| ChTry MALDI |
 |
|---|
| ArgC MALDI |
 |
|---|
| LysN MALDI |
 |
|---|
| TryLysC MALDI |
 |
|---|
| Try LTQ |
 |
|---|
| ChTry LTQ |
 |
|---|
| ArgC LTQ |
 |
|---|
| LysN LTQ |
 |
|---|
| TryLysC LTQ |
 |
|---|
| Try MSlow |
 |
|---|
| ChTry MSlow |
 |
|---|
| ArgC MSlow |
 |
|---|
| LysN MSlow |
 |
|---|
| TryLysC MSlow |
 |
|---|
| Try MShigh |
 |
|---|
| ChTry MShigh |
 |
|---|
| ArgC MShigh |
 |
|---|
| LysN MShigh |
 |
|---|
| TryLysC MShigh |
 |
|---|
General Statistics
Number of major isoforms |
Number of additional isoforms |
Number of all proteins |
Number of amino acids |
Min. Seq. Length |
Max. Seq. Length |
Avg. Seq. Length |
Avg. Mol. Weight |
|---|---|---|---|---|---|---|---|
0 |
1391700 |
41 |
6116 |
332.1 |
35.66 |
Amino acid frequency
Ala |
Cys |
Asp |
Glu |
Phe |
Gly |
His |
Ile |
Lys |
Leu |
|---|---|---|---|---|---|---|---|---|---|
12.672 ± 0.046 | 0.734 ± 0.01 |
6.607 ± 0.032 | 5.794 ± 0.035 |
2.977 ± 0.019 | 8.937 ± 0.035 |
2.136 ± 0.016 | 4.421 ± 0.023 |
2.301 ± 0.031 | 9.464 ± 0.034 |
Met |
Asn |
Gln |
Pro |
Arg |
Ser |
Thr |
Val |
Trp |
Tyr |
|---|---|---|---|---|---|---|---|---|---|
1.965 ± 0.016 | 2.071 ± 0.018 |
5.826 ± 0.033 | 2.594 ± 0.019 |
7.518 ± 0.04 | 5.546 ± 0.025 |
6.124 ± 0.022 | 8.879 ± 0.034 |
1.408 ± 0.017 | 2.027 ± 0.017 |
Most of the basic statistics you can see at this page can be downloaded from this CSV file
Proteome-pI is available under Creative Commons Attribution-NoDerivs license, for more details see here
| Reference: Kozlowski LP. Proteome-pI 2.0: Proteome Isoelectric Point Database Update. Nucleic Acids Res. 2021, doi: 10.1093/nar/gkab944 | Contact: Lukasz P. Kozlowski |
