Parashewanella spongiae
Taxonomy: cellular organisms; Bacteria; Proteobacteria; Gammaproteobacteria; Alteromonadales; Shewanellaceae; Parashewanella
Average proteome isoelectric point is 6.5
Get precalculated fractions of proteins

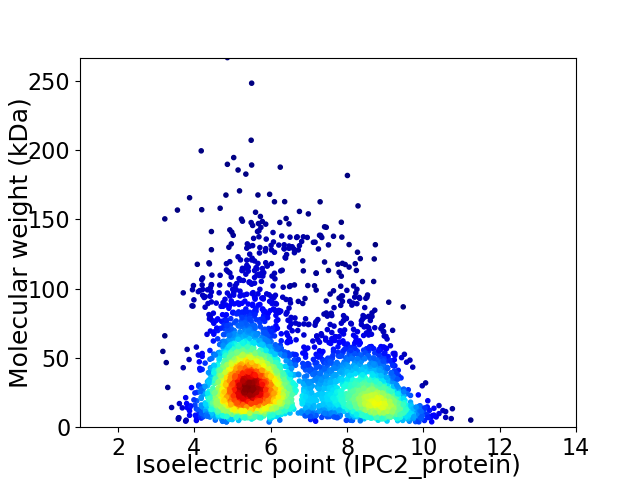
Virtual 2D-PAGE plot for 3857 proteins (isoelectric point calculated using IPC2_protein)
Get csv file with sequences according to given criteria:
* You can choose from 21 different methods for calculating isoelectric point
Summary statistics related to proteome-wise predictions


Protein with the lowest isoelectric point:
>tr|A0A3A6TCS2|A0A3A6TCS2_9GAMM Methylcrotonoyl-CoA carboxylase OS=Parashewanella spongiae OX=342950 GN=D5R81_14950 PE=4 SV=1
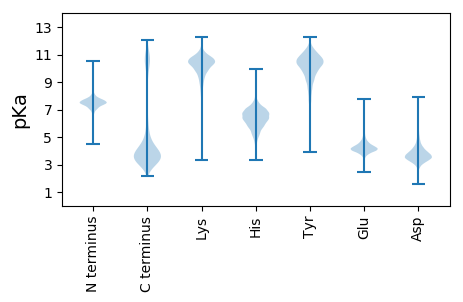
MM1 pKa = 7.2PTRR4 pKa = 11.84TRR6 pKa = 11.84KK7 pKa = 9.89LLIAIAVSSIFSASVVAGDD26 pKa = 4.27HH27 pKa = 6.28NEE29 pKa = 3.51ITIDD33 pKa = 3.37QRR35 pKa = 11.84TVSNEE40 pKa = 3.52GQTATSTQFGSFNQSTINQEE60 pKa = 3.29GDD62 pKa = 3.46AQDD65 pKa = 3.37SSVIQNGEE73 pKa = 4.29YY74 pKa = 10.22NVSSLTSNGYY84 pKa = 11.11GNTQFIEE91 pKa = 4.01QTGEE95 pKa = 4.07YY96 pKa = 9.75NNSTVAVYY104 pKa = 11.01GDD106 pKa = 3.88ANVNDD111 pKa = 3.79VTQDD115 pKa = 2.85ISNYY119 pKa = 9.83SYY121 pKa = 11.5SEE123 pKa = 3.89TRR125 pKa = 11.84GSDD128 pKa = 3.34NEE130 pKa = 4.02NTITQNGISNYY141 pKa = 10.28NYY143 pKa = 10.25FSFSGDD149 pKa = 3.64NNVHH153 pKa = 6.1TLDD156 pKa = 4.37QAGEE160 pKa = 4.26DD161 pKa = 3.78NQSYY165 pKa = 9.82FYY167 pKa = 11.22SFNEE171 pKa = 3.93ANRR174 pKa = 11.84NTATITQGGQYY185 pKa = 9.05NQSRR189 pKa = 11.84IVNVGSDD196 pKa = 3.63DD197 pKa = 3.94NEE199 pKa = 4.09FVISQDD205 pKa = 2.96GDD207 pKa = 4.16SNSSLIQGTVGHH219 pKa = 6.39TNSFNISQVDD229 pKa = 3.86FLNTARR235 pKa = 11.84LINVAGNNNEE245 pKa = 3.75ITVDD249 pKa = 3.79QDD251 pKa = 2.94GDD253 pKa = 3.76QNNVGDD259 pKa = 3.98GDD261 pKa = 3.89VAEE264 pKa = 4.88FSGDD268 pKa = 3.48NNVVNITQTGASNRR282 pKa = 11.84TDD284 pKa = 3.09MRR286 pKa = 11.84VLGDD290 pKa = 3.67ANTVSLHH297 pKa = 5.66QDD299 pKa = 3.22GNSHH303 pKa = 5.68YY304 pKa = 11.57ARR306 pKa = 11.84MTTDD310 pKa = 3.17GNSNTVNASQSGDD323 pKa = 2.84INMIDD328 pKa = 3.35ILTTGDD334 pKa = 3.48EE335 pKa = 4.21NSIEE339 pKa = 4.02LAQVGGSNDD348 pKa = 2.64ISGIDD353 pKa = 3.69GVSADD358 pKa = 4.17FGVTGSNNTLTISQTGNLNSVFGSSTGSANSISVAQTGTSNTAVTTQNN406 pKa = 3.14
MM1 pKa = 7.2PTRR4 pKa = 11.84TRR6 pKa = 11.84KK7 pKa = 9.89LLIAIAVSSIFSASVVAGDD26 pKa = 4.27HH27 pKa = 6.28NEE29 pKa = 3.51ITIDD33 pKa = 3.37QRR35 pKa = 11.84TVSNEE40 pKa = 3.52GQTATSTQFGSFNQSTINQEE60 pKa = 3.29GDD62 pKa = 3.46AQDD65 pKa = 3.37SSVIQNGEE73 pKa = 4.29YY74 pKa = 10.22NVSSLTSNGYY84 pKa = 11.11GNTQFIEE91 pKa = 4.01QTGEE95 pKa = 4.07YY96 pKa = 9.75NNSTVAVYY104 pKa = 11.01GDD106 pKa = 3.88ANVNDD111 pKa = 3.79VTQDD115 pKa = 2.85ISNYY119 pKa = 9.83SYY121 pKa = 11.5SEE123 pKa = 3.89TRR125 pKa = 11.84GSDD128 pKa = 3.34NEE130 pKa = 4.02NTITQNGISNYY141 pKa = 10.28NYY143 pKa = 10.25FSFSGDD149 pKa = 3.64NNVHH153 pKa = 6.1TLDD156 pKa = 4.37QAGEE160 pKa = 4.26DD161 pKa = 3.78NQSYY165 pKa = 9.82FYY167 pKa = 11.22SFNEE171 pKa = 3.93ANRR174 pKa = 11.84NTATITQGGQYY185 pKa = 9.05NQSRR189 pKa = 11.84IVNVGSDD196 pKa = 3.63DD197 pKa = 3.94NEE199 pKa = 4.09FVISQDD205 pKa = 2.96GDD207 pKa = 4.16SNSSLIQGTVGHH219 pKa = 6.39TNSFNISQVDD229 pKa = 3.86FLNTARR235 pKa = 11.84LINVAGNNNEE245 pKa = 3.75ITVDD249 pKa = 3.79QDD251 pKa = 2.94GDD253 pKa = 3.76QNNVGDD259 pKa = 3.98GDD261 pKa = 3.89VAEE264 pKa = 4.88FSGDD268 pKa = 3.48NNVVNITQTGASNRR282 pKa = 11.84TDD284 pKa = 3.09MRR286 pKa = 11.84VLGDD290 pKa = 3.67ANTVSLHH297 pKa = 5.66QDD299 pKa = 3.22GNSHH303 pKa = 5.68YY304 pKa = 11.57ARR306 pKa = 11.84MTTDD310 pKa = 3.17GNSNTVNASQSGDD323 pKa = 2.84INMIDD328 pKa = 3.35ILTTGDD334 pKa = 3.48EE335 pKa = 4.21NSIEE339 pKa = 4.02LAQVGGSNDD348 pKa = 2.64ISGIDD353 pKa = 3.69GVSADD358 pKa = 4.17FGVTGSNNTLTISQTGNLNSVFGSSTGSANSISVAQTGTSNTAVTTQNN406 pKa = 3.14
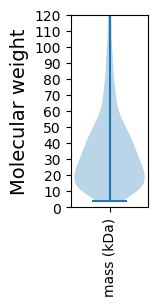
Molecular weight: 42.94 kDa
Isoelectric point according different methods:
Protein with the highest isoelectric point:
>tr|A0A3A6TUA9|A0A3A6TUA9_9GAMM DEDD_Tnp_IS110 domain-containing protein OS=Parashewanella spongiae OX=342950 GN=D5R81_12240 PE=4 SV=1
MM1 pKa = 7.69SKK3 pKa = 9.01RR4 pKa = 11.84TFQPSNLKK12 pKa = 10.14RR13 pKa = 11.84KK14 pKa = 9.13RR15 pKa = 11.84SHH17 pKa = 6.17GFRR20 pKa = 11.84ARR22 pKa = 11.84MATVGGRR29 pKa = 11.84KK30 pKa = 9.01VLARR34 pKa = 11.84RR35 pKa = 11.84RR36 pKa = 11.84AKK38 pKa = 10.39GRR40 pKa = 11.84ARR42 pKa = 11.84LSAA45 pKa = 3.91
MM1 pKa = 7.69SKK3 pKa = 9.01RR4 pKa = 11.84TFQPSNLKK12 pKa = 10.14RR13 pKa = 11.84KK14 pKa = 9.13RR15 pKa = 11.84SHH17 pKa = 6.17GFRR20 pKa = 11.84ARR22 pKa = 11.84MATVGGRR29 pKa = 11.84KK30 pKa = 9.01VLARR34 pKa = 11.84RR35 pKa = 11.84RR36 pKa = 11.84AKK38 pKa = 10.39GRR40 pKa = 11.84ARR42 pKa = 11.84LSAA45 pKa = 3.91
Molecular weight: 5.15 kDa
Isoelectric point according different methods:
Peptides (in silico digests for buttom-up proteomics)
Below you can find in silico digests of the whole proteome with Trypsin, Chymotrypsin, Trypsin+LysC, LysN, ArgC proteases suitable for different mass spec machines.| Try ESI |
 |
|---|
| ChTry ESI |
 |
|---|
| ArgC ESI |
 |
|---|
| LysN ESI |
 |
|---|
| TryLysC ESI |
 |
|---|
| Try MALDI |
 |
|---|
| ChTry MALDI |
 |
|---|
| ArgC MALDI |
 |
|---|
| LysN MALDI |
 |
|---|
| TryLysC MALDI |
 |
|---|
| Try LTQ |
 |
|---|
| ChTry LTQ |
 |
|---|
| ArgC LTQ |
 |
|---|
| LysN LTQ |
 |
|---|
| TryLysC LTQ |
 |
|---|
| Try MSlow |
 |
|---|
| ChTry MSlow |
 |
|---|
| ArgC MSlow |
 |
|---|
| LysN MSlow |
 |
|---|
| TryLysC MSlow |
 |
|---|
| Try MShigh |
 |
|---|
| ChTry MShigh |
 |
|---|
| ArgC MShigh |
 |
|---|
| LysN MShigh |
 |
|---|
| TryLysC MShigh |
 |
|---|
General Statistics
Number of major isoforms |
Number of additional isoforms |
Number of all proteins |
Number of amino acids |
Min. Seq. Length |
Max. Seq. Length |
Avg. Seq. Length |
Avg. Mol. Weight |
|---|---|---|---|---|---|---|---|
0 |
1325279 |
33 |
2457 |
343.6 |
38.38 |
Amino acid frequency
Ala |
Cys |
Asp |
Glu |
Phe |
Gly |
His |
Ile |
Lys |
Leu |
|---|---|---|---|---|---|---|---|---|---|
7.688 ± 0.043 | 1.249 ± 0.02 |
5.452 ± 0.031 | 6.19 ± 0.041 |
4.232 ± 0.024 | 6.115 ± 0.042 |
2.316 ± 0.017 | 6.752 ± 0.028 |
6.304 ± 0.04 | 10.372 ± 0.048 |
Met |
Asn |
Gln |
Pro |
Arg |
Ser |
Thr |
Val |
Trp |
Tyr |
|---|---|---|---|---|---|---|---|---|---|
2.341 ± 0.017 | 4.916 ± 0.03 |
3.753 ± 0.025 | 4.726 ± 0.03 |
4.186 ± 0.03 | 7.335 ± 0.041 |
5.531 ± 0.029 | 6.389 ± 0.034 |
1.122 ± 0.015 | 3.032 ± 0.021 |
Most of the basic statistics you can see at this page can be downloaded from this CSV file
Proteome-pI is available under Creative Commons Attribution-NoDerivs license, for more details see here
| Reference: Kozlowski LP. Proteome-pI 2.0: Proteome Isoelectric Point Database Update. Nucleic Acids Res. 2021, doi: 10.1093/nar/gkab944 | Contact: Lukasz P. Kozlowski |
