Streptomyces curacoi
Taxonomy: cellular organisms; Bacteria; Terrabacteria group; Actinobacteria; Actinomycetia; Streptomycetales; Streptomycetaceae; Streptomyces
Average proteome isoelectric point is 6.33
Get precalculated fractions of proteins
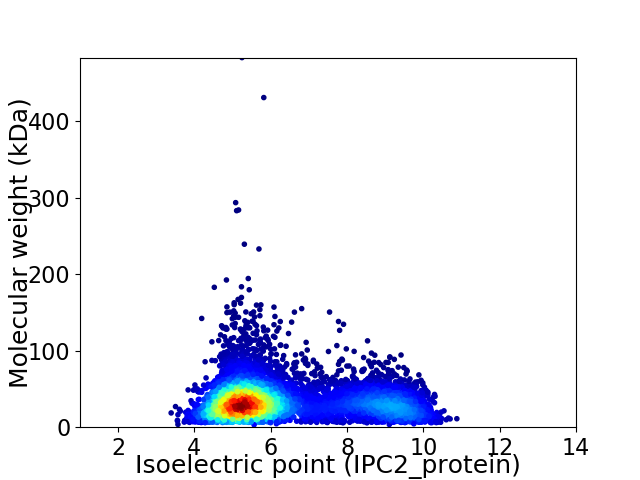
Virtual 2D-PAGE plot for 7114 proteins (isoelectric point calculated using IPC2_protein)
Get csv file with sequences according to given criteria:
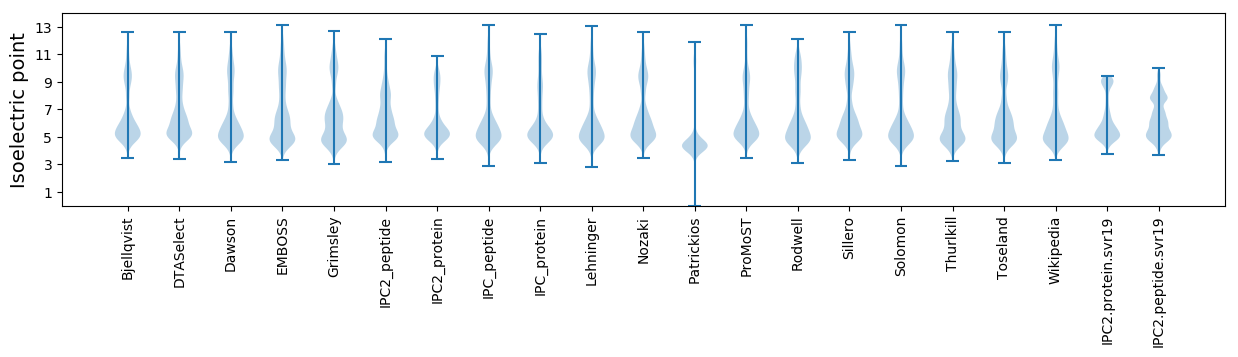
* You can choose from 21 different methods for calculating isoelectric point
Summary statistics related to proteome-wise predictions
Protein with the lowest isoelectric point:
>tr|A0A124GXP9|A0A124GXP9_9ACTN GTP pyrophosphokinase OS=Streptomyces curacoi OX=146536 GN=AQI70_26530 PE=3 SV=1
MM1 pKa = 7.1QSTYY5 pKa = 10.51IAGQEE10 pKa = 4.2VVLDD14 pKa = 4.07DD15 pKa = 4.64APIFGPVDD23 pKa = 3.24VDD25 pKa = 3.82DD26 pKa = 4.62GVVVIVQEE34 pKa = 4.25LGPVRR39 pKa = 11.84GFSAAEE45 pKa = 3.56VWGCLVSDD53 pKa = 4.25HH54 pKa = 6.65LCWHH58 pKa = 7.14AA59 pKa = 4.6
MM1 pKa = 7.1QSTYY5 pKa = 10.51IAGQEE10 pKa = 4.2VVLDD14 pKa = 4.07DD15 pKa = 4.64APIFGPVDD23 pKa = 3.24VDD25 pKa = 3.82DD26 pKa = 4.62GVVVIVQEE34 pKa = 4.25LGPVRR39 pKa = 11.84GFSAAEE45 pKa = 3.56VWGCLVSDD53 pKa = 4.25HH54 pKa = 6.65LCWHH58 pKa = 7.14AA59 pKa = 4.6
Molecular weight: 6.31 kDa
Isoelectric point according different methods:
Protein with the highest isoelectric point:
>tr|A0A117NUT8|A0A117NUT8_9ACTN Alpha-L-fucosidase OS=Streptomyces curacoi OX=146536 GN=AQI70_35425 PE=4 SV=1
MM1 pKa = 7.35AVVPVAAVVPVAVAVVRR18 pKa = 11.84AAAVSPVVPAVPVAVAAVSPVVPAVPVAVAAVSPAVLVVPAVAAVAVPASVVVPAVPVAVVARR81 pKa = 11.84RR82 pKa = 11.84VPSAVPAVPRR92 pKa = 11.84VVAVSRR98 pKa = 11.84SGRR101 pKa = 11.84GARR104 pKa = 11.84STRR107 pKa = 11.84PCRR110 pKa = 11.84PRR112 pKa = 11.84RR113 pKa = 11.84SAAA116 pKa = 3.18
MM1 pKa = 7.35AVVPVAAVVPVAVAVVRR18 pKa = 11.84AAAVSPVVPAVPVAVAAVSPVVPAVPVAVAAVSPAVLVVPAVAAVAVPASVVVPAVPVAVVARR81 pKa = 11.84RR82 pKa = 11.84VPSAVPAVPRR92 pKa = 11.84VVAVSRR98 pKa = 11.84SGRR101 pKa = 11.84GARR104 pKa = 11.84STRR107 pKa = 11.84PCRR110 pKa = 11.84PRR112 pKa = 11.84RR113 pKa = 11.84SAAA116 pKa = 3.18
Molecular weight: 11.1 kDa
Isoelectric point according different methods:
Peptides (in silico digests for buttom-up proteomics)
Below you can find in silico digests of the whole proteome with Trypsin, Chymotrypsin, Trypsin+LysC, LysN, ArgC proteases suitable for different mass spec machines.| Try ESI |
 |
|---|
| ChTry ESI |
|
|---|
| ArgC ESI |
|
|---|
| LysN ESI |
|
|---|
| TryLysC ESI |
|
|---|
| Try MALDI |
|
|---|
| ChTry MALDI |
|
|---|
| ArgC MALDI |
|
|---|
| LysN MALDI |
|
|---|
| TryLysC MALDI |
|
|---|
| Try LTQ |
|
|---|
| ChTry LTQ |
|
|---|
| ArgC LTQ |
|
|---|
| LysN LTQ |
|
|---|
| TryLysC LTQ |
|
|---|
| Try MSlow |
|
|---|
| ChTry MSlow |
|
|---|
| ArgC MSlow |
|
|---|
| LysN MSlow |
|
|---|
| TryLysC MSlow |
|
|---|
| Try MShigh |
|
|---|
| ChTry MShigh |
|
|---|
| ArgC MShigh |
|
|---|
| LysN MShigh |
|
|---|
| TryLysC MShigh |
|
|---|
General Statistics
Number of major isoforms |
Number of additional isoforms |
Number of all proteins |
Number of amino acids |
Min. Seq. Length |
Max. Seq. Length |
Avg. Seq. Length |
Avg. Mol. Weight |
|---|---|---|---|---|---|---|---|
0 |
2369746 |
29 |
4557 |
333.1 |
35.76 |
Amino acid frequency
Ala |
Cys |
Asp |
Glu |
Phe |
Gly |
His |
Ile |
Lys |
Leu |
|---|---|---|---|---|---|---|---|---|---|
13.371 ± 0.048 | 0.793 ± 0.009 |
6.009 ± 0.025 | 5.846 ± 0.031 |
2.749 ± 0.018 | 9.344 ± 0.03 |
2.298 ± 0.014 | 3.211 ± 0.021 |
2.32 ± 0.027 | 10.296 ± 0.038 |
Met |
Asn |
Gln |
Pro |
Arg |
Ser |
Thr |
Val |
Trp |
Tyr |
|---|---|---|---|---|---|---|---|---|---|
1.732 ± 0.013 | 1.828 ± 0.019 |
6.04 ± 0.024 | 2.817 ± 0.017 |
7.969 ± 0.034 | 5.021 ± 0.023 |
6.128 ± 0.026 | 8.483 ± 0.029 |
1.559 ± 0.012 | 2.187 ± 0.014 |
Most of the basic statistics you can see at this page can be downloaded from this CSV file
See this proteome in:

Proteome-pI is available under Creative Commons Attribution-NoDerivs license, for more details see here
| Reference: Kozlowski LP. Proteome-pI 2.0: Proteome Isoelectric Point Database Update. Nucleic Acids Res. 2021, doi: 10.1093/nar/gkab944 | Contact: Lukasz P. Kozlowski |