Ensifer sp. LCM 4579
Taxonomy: cellular organisms; Bacteria; Proteobacteria; Alphaproteobacteria; Hyphomicrobiales; Rhizobiaceae; Sinorhizobium/Ensifer group; Ensifer; unclassified Ensifer
Average proteome isoelectric point is 6.46
Get precalculated fractions of proteins

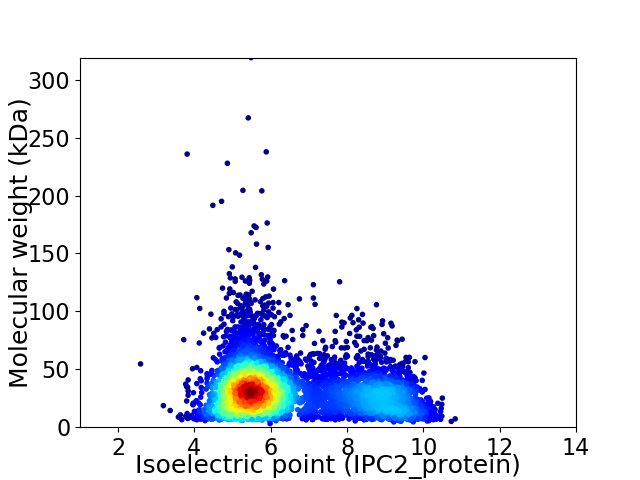
Virtual 2D-PAGE plot for 5430 proteins (isoelectric point calculated using IPC2_protein)
Get csv file with sequences according to given criteria:
* You can choose from 21 different methods for calculating isoelectric point
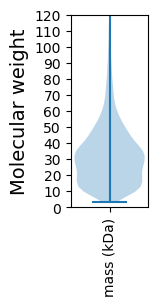
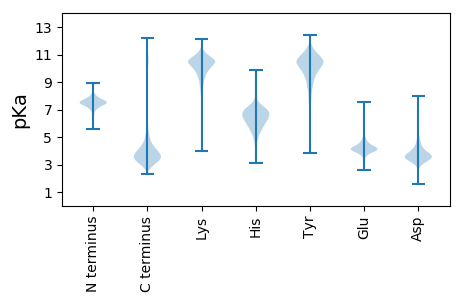
Summary statistics related to proteome-wise predictions


Protein with the lowest isoelectric point:
>tr|A0A1S1SQC4|A0A1S1SQC4_9RHIZ Dehydrogenase OS=Ensifer sp. LCM 4579 OX=1848292 GN=LCM4579_08300 PE=3 SV=1
MM1 pKa = 7.78ADD3 pKa = 3.81SRR5 pKa = 11.84PLSDD9 pKa = 5.41DD10 pKa = 3.74APNTNTDD17 pKa = 2.89QSTVAAGHH25 pKa = 6.71LALVPTWLPFDD36 pKa = 3.47IAGDD40 pKa = 3.77SGQNAAGNGGDD51 pKa = 3.73GTSVGIVGSNTLAMFVPSNMAIAGPQSNAGAEE83 pKa = 4.06QGNNALIYY91 pKa = 9.39QHH93 pKa = 5.91ATEE96 pKa = 4.15MAGIGGDD103 pKa = 3.44GGSGNHH109 pKa = 7.28AIGSVGNANLAGNGGNGTFFGSLLSTDD136 pKa = 3.75VAVFAPVNTAVAAGPGATATAEE158 pKa = 4.17QTNNAAILQGATQVGGVGGAGGDD181 pKa = 3.68HH182 pKa = 6.68NSAGGAPAASAGATFTFTGDD202 pKa = 2.79NYY204 pKa = 10.87AGHH207 pKa = 6.9GGDD210 pKa = 3.38GTFIGSMVDD219 pKa = 3.07VNVAVFSPINIAVGAAGGNAQATQTNNVIFDD250 pKa = 3.46QGGVQIAGIGGNGGGFNLSSDD271 pKa = 4.01TIFTGNAVGAGGGGGTGHH289 pKa = 6.0STGSLVDD296 pKa = 3.42VNIGYY301 pKa = 7.43FHH303 pKa = 7.46PVNIAVPAGGTAEE316 pKa = 4.54ADD318 pKa = 3.53QLNHH322 pKa = 5.96VLYY325 pKa = 10.49DD326 pKa = 3.32QHH328 pKa = 6.26TLQLGGIGGAGGHH341 pKa = 6.08GNIADD346 pKa = 4.13ANSSLVDD353 pKa = 3.79DD354 pKa = 4.51VLALVNAA361 pKa = 5.04
MM1 pKa = 7.78ADD3 pKa = 3.81SRR5 pKa = 11.84PLSDD9 pKa = 5.41DD10 pKa = 3.74APNTNTDD17 pKa = 2.89QSTVAAGHH25 pKa = 6.71LALVPTWLPFDD36 pKa = 3.47IAGDD40 pKa = 3.77SGQNAAGNGGDD51 pKa = 3.73GTSVGIVGSNTLAMFVPSNMAIAGPQSNAGAEE83 pKa = 4.06QGNNALIYY91 pKa = 9.39QHH93 pKa = 5.91ATEE96 pKa = 4.15MAGIGGDD103 pKa = 3.44GGSGNHH109 pKa = 7.28AIGSVGNANLAGNGGNGTFFGSLLSTDD136 pKa = 3.75VAVFAPVNTAVAAGPGATATAEE158 pKa = 4.17QTNNAAILQGATQVGGVGGAGGDD181 pKa = 3.68HH182 pKa = 6.68NSAGGAPAASAGATFTFTGDD202 pKa = 2.79NYY204 pKa = 10.87AGHH207 pKa = 6.9GGDD210 pKa = 3.38GTFIGSMVDD219 pKa = 3.07VNVAVFSPINIAVGAAGGNAQATQTNNVIFDD250 pKa = 3.46QGGVQIAGIGGNGGGFNLSSDD271 pKa = 4.01TIFTGNAVGAGGGGGTGHH289 pKa = 6.0STGSLVDD296 pKa = 3.42VNIGYY301 pKa = 7.43FHH303 pKa = 7.46PVNIAVPAGGTAEE316 pKa = 4.54ADD318 pKa = 3.53QLNHH322 pKa = 5.96VLYY325 pKa = 10.49DD326 pKa = 3.32QHH328 pKa = 6.26TLQLGGIGGAGGHH341 pKa = 6.08GNIADD346 pKa = 4.13ANSSLVDD353 pKa = 3.79DD354 pKa = 4.51VLALVNAA361 pKa = 5.04
Molecular weight: 34.39 kDa
Isoelectric point according different methods:
Protein with the highest isoelectric point:
>tr|A0A1S1SZX3|A0A1S1SZX3_9RHIZ Molybdopterin-guanine dinucleotide biosynthesis protein B OS=Ensifer sp. LCM 4579 OX=1848292 GN=LCM4579_05235 PE=4 SV=1
MM1 pKa = 7.88PSFLTAVTLFVMGLVAIVLIRR22 pKa = 11.84GLLNMARR29 pKa = 11.84RR30 pKa = 11.84GSGNTSNKK38 pKa = 8.96LMQMRR43 pKa = 11.84ILLQAVALVLIMLTLWITGGGRR65 pKa = 11.84PAA67 pKa = 4.25
MM1 pKa = 7.88PSFLTAVTLFVMGLVAIVLIRR22 pKa = 11.84GLLNMARR29 pKa = 11.84RR30 pKa = 11.84GSGNTSNKK38 pKa = 8.96LMQMRR43 pKa = 11.84ILLQAVALVLIMLTLWITGGGRR65 pKa = 11.84PAA67 pKa = 4.25
Molecular weight: 7.21 kDa
Isoelectric point according different methods:
Peptides (in silico digests for buttom-up proteomics)
Below you can find in silico digests of the whole proteome with Trypsin, Chymotrypsin, Trypsin+LysC, LysN, ArgC proteases suitable for different mass spec machines.| Try ESI |
 |
|---|
| ChTry ESI |
 |
|---|
| ArgC ESI |
 |
|---|
| LysN ESI |
 |
|---|
| TryLysC ESI |
 |
|---|
| Try MALDI |
 |
|---|
| ChTry MALDI |
 |
|---|
| ArgC MALDI |
 |
|---|
| LysN MALDI |
 |
|---|
| TryLysC MALDI |
 |
|---|
| Try LTQ |
 |
|---|
| ChTry LTQ |
 |
|---|
| ArgC LTQ |
 |
|---|
| LysN LTQ |
 |
|---|
| TryLysC LTQ |
 |
|---|
| Try MSlow |
 |
|---|
| ChTry MSlow |
 |
|---|
| ArgC MSlow |
 |
|---|
| LysN MSlow |
 |
|---|
| TryLysC MSlow |
 |
|---|
| Try MShigh |
 |
|---|
| ChTry MShigh |
 |
|---|
| ArgC MShigh |
 |
|---|
| LysN MShigh |
 |
|---|
| TryLysC MShigh |
 |
|---|
General Statistics
Number of major isoforms |
Number of additional isoforms |
Number of all proteins |
Number of amino acids |
Min. Seq. Length |
Max. Seq. Length |
Avg. Seq. Length |
Avg. Mol. Weight |
|---|---|---|---|---|---|---|---|
0 |
1696053 |
28 |
2870 |
312.3 |
34.03 |
Amino acid frequency
Ala |
Cys |
Asp |
Glu |
Phe |
Gly |
His |
Ile |
Lys |
Leu |
|---|---|---|---|---|---|---|---|---|---|
12.198 ± 0.046 | 0.875 ± 0.011 |
5.548 ± 0.024 | 6.155 ± 0.036 |
3.912 ± 0.022 | 8.362 ± 0.032 |
2.064 ± 0.018 | 5.519 ± 0.022 |
3.412 ± 0.026 | 10.046 ± 0.039 |
Met |
Asn |
Gln |
Pro |
Arg |
Ser |
Thr |
Val |
Trp |
Tyr |
|---|---|---|---|---|---|---|---|---|---|
2.497 ± 0.014 | 2.661 ± 0.017 |
4.934 ± 0.022 | 2.946 ± 0.018 |
7.209 ± 0.039 | 5.586 ± 0.025 |
5.14 ± 0.022 | 7.36 ± 0.024 |
1.287 ± 0.013 | 2.289 ± 0.017 |
Most of the basic statistics you can see at this page can be downloaded from this CSV file
Proteome-pI is available under Creative Commons Attribution-NoDerivs license, for more details see here
| Reference: Kozlowski LP. Proteome-pI 2.0: Proteome Isoelectric Point Database Update. Nucleic Acids Res. 2021, doi: 10.1093/nar/gkab944 | Contact: Lukasz P. Kozlowski |
