Facklamia sp. 252
Taxonomy: cellular organisms; Bacteria; Terrabacteria group; Firmicutes; Bacilli; Lactobacillales; Aerococcaceae; Facklamia; unclassified Facklamia
Average proteome isoelectric point is 6.05
Get precalculated fractions of proteins

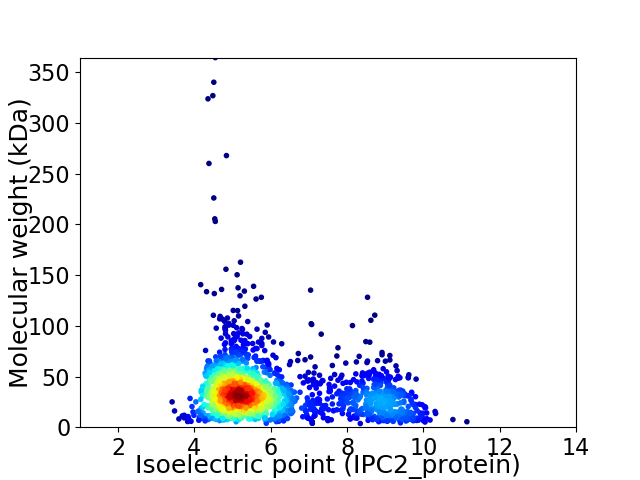
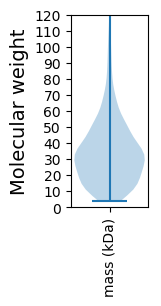
Virtual 2D-PAGE plot for 1842 proteins (isoelectric point calculated using IPC2_protein)
Get csv file with sequences according to given criteria:
* You can choose from 21 different methods for calculating isoelectric point
Summary statistics related to proteome-wise predictions


Protein with the lowest isoelectric point:
>tr|A0A6M0L9P4|A0A6M0L9P4_9LACT Galactose-1-phosphate uridylyltransferase OS=Facklamia sp. 252 OX=2678501 GN=galT PE=3 SV=1
MM1 pKa = 7.26SFSRR5 pKa = 11.84IAKK8 pKa = 10.01VYY10 pKa = 11.02DD11 pKa = 3.39RR12 pKa = 11.84FNDD15 pKa = 3.73LEE17 pKa = 4.89VYY19 pKa = 8.0EE20 pKa = 4.15QWLDD24 pKa = 3.54FTLNSVDD31 pKa = 3.65QQPQKK36 pKa = 11.17VLDD39 pKa = 4.07VACGTGWFTSLLAPFVTSITGMDD62 pKa = 4.01IDD64 pKa = 4.94NEE66 pKa = 4.13MLEE69 pKa = 4.44IARR72 pKa = 11.84SEE74 pKa = 4.32DD75 pKa = 3.19PGQVVQYY82 pKa = 10.08VQGDD86 pKa = 4.03MLSMEE91 pKa = 4.86TFASDD96 pKa = 3.42YY97 pKa = 11.7DD98 pKa = 4.48LVTCYY103 pKa = 10.96ADD105 pKa = 3.31SLCFLEE111 pKa = 5.28NAEE114 pKa = 4.32QVQQAIRR121 pKa = 11.84QMLNRR126 pKa = 11.84LAPGGTLLFDD136 pKa = 3.26VWTPYY141 pKa = 10.58QVTTGFDD148 pKa = 3.13GFSYY152 pKa = 10.66FDD154 pKa = 3.65SDD156 pKa = 3.36EE157 pKa = 4.21TAALLWDD164 pKa = 3.79SAVDD168 pKa = 3.87AEE170 pKa = 4.6TLTMEE175 pKa = 4.59HH176 pKa = 6.74YY177 pKa = 9.88LTVFMQQQDD186 pKa = 3.05GRR188 pKa = 11.84YY189 pKa = 9.07DD190 pKa = 3.59RR191 pKa = 11.84EE192 pKa = 4.03EE193 pKa = 4.14VVLTEE198 pKa = 3.65HH199 pKa = 7.54AYY201 pKa = 9.69PLSVYY206 pKa = 9.82QAAFDD211 pKa = 3.78IDD213 pKa = 3.74EE214 pKa = 4.41VASVEE219 pKa = 4.12VLVNFGEE226 pKa = 4.46AIYY229 pKa = 11.01DD230 pKa = 3.69EE231 pKa = 4.64MTHH234 pKa = 6.25QEE236 pKa = 3.63AEE238 pKa = 3.68RR239 pKa = 11.84WFFRR243 pKa = 11.84VVKK246 pKa = 10.47RR247 pKa = 3.92
MM1 pKa = 7.26SFSRR5 pKa = 11.84IAKK8 pKa = 10.01VYY10 pKa = 11.02DD11 pKa = 3.39RR12 pKa = 11.84FNDD15 pKa = 3.73LEE17 pKa = 4.89VYY19 pKa = 8.0EE20 pKa = 4.15QWLDD24 pKa = 3.54FTLNSVDD31 pKa = 3.65QQPQKK36 pKa = 11.17VLDD39 pKa = 4.07VACGTGWFTSLLAPFVTSITGMDD62 pKa = 4.01IDD64 pKa = 4.94NEE66 pKa = 4.13MLEE69 pKa = 4.44IARR72 pKa = 11.84SEE74 pKa = 4.32DD75 pKa = 3.19PGQVVQYY82 pKa = 10.08VQGDD86 pKa = 4.03MLSMEE91 pKa = 4.86TFASDD96 pKa = 3.42YY97 pKa = 11.7DD98 pKa = 4.48LVTCYY103 pKa = 10.96ADD105 pKa = 3.31SLCFLEE111 pKa = 5.28NAEE114 pKa = 4.32QVQQAIRR121 pKa = 11.84QMLNRR126 pKa = 11.84LAPGGTLLFDD136 pKa = 3.26VWTPYY141 pKa = 10.58QVTTGFDD148 pKa = 3.13GFSYY152 pKa = 10.66FDD154 pKa = 3.65SDD156 pKa = 3.36EE157 pKa = 4.21TAALLWDD164 pKa = 3.79SAVDD168 pKa = 3.87AEE170 pKa = 4.6TLTMEE175 pKa = 4.59HH176 pKa = 6.74YY177 pKa = 9.88LTVFMQQQDD186 pKa = 3.05GRR188 pKa = 11.84YY189 pKa = 9.07DD190 pKa = 3.59RR191 pKa = 11.84EE192 pKa = 4.03EE193 pKa = 4.14VVLTEE198 pKa = 3.65HH199 pKa = 7.54AYY201 pKa = 9.69PLSVYY206 pKa = 9.82QAAFDD211 pKa = 3.78IDD213 pKa = 3.74EE214 pKa = 4.41VASVEE219 pKa = 4.12VLVNFGEE226 pKa = 4.46AIYY229 pKa = 11.01DD230 pKa = 3.69EE231 pKa = 4.64MTHH234 pKa = 6.25QEE236 pKa = 3.63AEE238 pKa = 3.68RR239 pKa = 11.84WFFRR243 pKa = 11.84VVKK246 pKa = 10.47RR247 pKa = 3.92
Molecular weight: 28.36 kDa
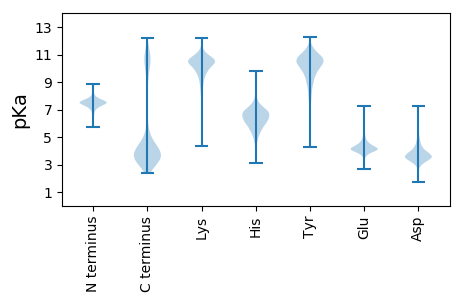
Isoelectric point according different methods:
Protein with the highest isoelectric point:
>tr|A0A6M0LBK2|A0A6M0LBK2_9LACT ABC transporter permease subunit OS=Facklamia sp. 252 OX=2678501 GN=GL993_08695 PE=3 SV=1
MM1 pKa = 7.36KK2 pKa = 9.43RR3 pKa = 11.84TYY5 pKa = 9.67QPKK8 pKa = 9.36KK9 pKa = 7.48RR10 pKa = 11.84TRR12 pKa = 11.84KK13 pKa = 9.06KK14 pKa = 8.41VHH16 pKa = 5.85GFRR19 pKa = 11.84KK20 pKa = 10.01RR21 pKa = 11.84MSTKK25 pKa = 9.36NGRR28 pKa = 11.84RR29 pKa = 11.84VLRR32 pKa = 11.84KK33 pKa = 9.23RR34 pKa = 11.84RR35 pKa = 11.84LKK37 pKa = 10.81GRR39 pKa = 11.84AKK41 pKa = 10.68LSAA44 pKa = 3.92
MM1 pKa = 7.36KK2 pKa = 9.43RR3 pKa = 11.84TYY5 pKa = 9.67QPKK8 pKa = 9.36KK9 pKa = 7.48RR10 pKa = 11.84TRR12 pKa = 11.84KK13 pKa = 9.06KK14 pKa = 8.41VHH16 pKa = 5.85GFRR19 pKa = 11.84KK20 pKa = 10.01RR21 pKa = 11.84MSTKK25 pKa = 9.36NGRR28 pKa = 11.84RR29 pKa = 11.84VLRR32 pKa = 11.84KK33 pKa = 9.23RR34 pKa = 11.84RR35 pKa = 11.84LKK37 pKa = 10.81GRR39 pKa = 11.84AKK41 pKa = 10.68LSAA44 pKa = 3.92
Molecular weight: 5.4 kDa
Isoelectric point according different methods:
Peptides (in silico digests for buttom-up proteomics)
Below you can find in silico digests of the whole proteome with Trypsin, Chymotrypsin, Trypsin+LysC, LysN, ArgC proteases suitable for different mass spec machines.| Try ESI |
 |
|---|
| ChTry ESI |
 |
|---|
| ArgC ESI |
 |
|---|
| LysN ESI |
 |
|---|
| TryLysC ESI |
 |
|---|
| Try MALDI |
 |
|---|
| ChTry MALDI |
 |
|---|
| ArgC MALDI |
 |
|---|
| LysN MALDI |
 |
|---|
| TryLysC MALDI |
 |
|---|
| Try LTQ |
 |
|---|
| ChTry LTQ |
 |
|---|
| ArgC LTQ |
 |
|---|
| LysN LTQ |
 |
|---|
| TryLysC LTQ |
 |
|---|
| Try MSlow |
 |
|---|
| ChTry MSlow |
 |
|---|
| ArgC MSlow |
 |
|---|
| LysN MSlow |
 |
|---|
| TryLysC MSlow |
 |
|---|
| Try MShigh |
 |
|---|
| ChTry MShigh |
 |
|---|
| ArgC MShigh |
 |
|---|
| LysN MShigh |
 |
|---|
| TryLysC MShigh |
 |
|---|
General Statistics
Number of major isoforms |
Number of additional isoforms |
Number of all proteins |
Number of amino acids |
Min. Seq. Length |
Max. Seq. Length |
Avg. Seq. Length |
Avg. Mol. Weight |
|---|---|---|---|---|---|---|---|
0 |
599143 |
32 |
3489 |
325.3 |
36.58 |
Amino acid frequency
Ala |
Cys |
Asp |
Glu |
Phe |
Gly |
His |
Ile |
Lys |
Leu |
|---|---|---|---|---|---|---|---|---|---|
7.403 ± 0.108 | 0.563 ± 0.015 |
5.316 ± 0.059 | 7.354 ± 0.073 |
4.282 ± 0.049 | 6.266 ± 0.061 |
2.027 ± 0.036 | 7.771 ± 0.061 |
6.119 ± 0.068 | 9.672 ± 0.093 |
Met |
Asn |
Gln |
Pro |
Arg |
Ser |
Thr |
Val |
Trp |
Tyr |
|---|---|---|---|---|---|---|---|---|---|
2.686 ± 0.037 | 4.881 ± 0.042 |
3.455 ± 0.072 | 4.55 ± 0.065 |
3.963 ± 0.043 | 5.864 ± 0.046 |
5.84 ± 0.058 | 7.117 ± 0.052 |
0.963 ± 0.022 | 3.907 ± 0.045 |
Most of the basic statistics you can see at this page can be downloaded from this CSV file
Proteome-pI is available under Creative Commons Attribution-NoDerivs license, for more details see here
| Reference: Kozlowski LP. Proteome-pI 2.0: Proteome Isoelectric Point Database Update. Nucleic Acids Res. 2021, doi: 10.1093/nar/gkab944 | Contact: Lukasz P. Kozlowski |
