Coriobacteriales bacterium OH1046
Taxonomy: cellular organisms; Bacteria; Terrabacteria group; Actinobacteria; Coriobacteriia; Coriobacteriales; unclassified Coriobacteriales
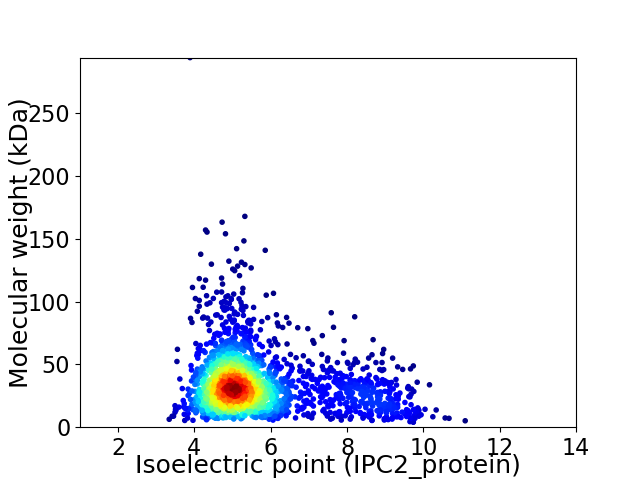
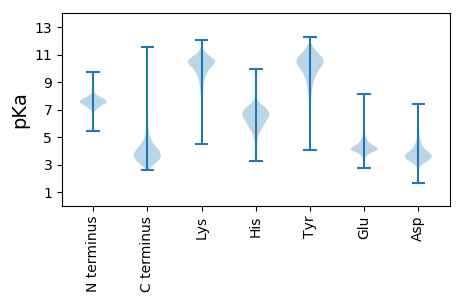
Average proteome isoelectric point is 5.69
Get precalculated fractions of proteins

Virtual 2D-PAGE plot for 2118 proteins (isoelectric point calculated using IPC2_protein)
Get csv file with sequences according to given criteria:
* You can choose from 21 different methods for calculating isoelectric point
Summary statistics related to proteome-wise predictions


Protein with the lowest isoelectric point:
>tr|A0A437UUM9|A0A437UUM9_9ACTN DNA topoisomerase 1 OS=Coriobacteriales bacterium OH1046 OX=2491116 GN=topA PE=3 SV=1
MM1 pKa = 7.14KK2 pKa = 10.2HH3 pKa = 6.14LRR5 pKa = 11.84TGIAACAVAVALAVGGCTGQADD27 pKa = 4.14EE28 pKa = 4.75TTSGTAEE35 pKa = 3.85QGTALDD41 pKa = 3.71QAGEE45 pKa = 4.38TEE47 pKa = 4.48RR48 pKa = 11.84SAEE51 pKa = 4.13EE52 pKa = 4.17PFSLTRR58 pKa = 11.84DD59 pKa = 3.44EE60 pKa = 5.11LVIDD64 pKa = 3.69EE65 pKa = 5.49TITDD69 pKa = 4.14DD70 pKa = 4.34ADD72 pKa = 3.36EE73 pKa = 4.25SHH75 pKa = 7.21AIIADD80 pKa = 3.7GTTEE84 pKa = 4.06SYY86 pKa = 11.02RR87 pKa = 11.84SIEE90 pKa = 4.11VVKK93 pKa = 10.2TGDD96 pKa = 3.57ADD98 pKa = 3.82GDD100 pKa = 3.94GADD103 pKa = 4.3FYY105 pKa = 10.88GTNAAVLATNGASLDD120 pKa = 3.9LADD123 pKa = 5.86SIVTSDD129 pKa = 3.4GTHH132 pKa = 6.29ANAVFSYY139 pKa = 11.54GEE141 pKa = 4.14GTVVNIAHH149 pKa = 6.8SIIEE153 pKa = 4.37TTGDD157 pKa = 3.4CSGGIMVTGGGTLNATDD174 pKa = 5.22LYY176 pKa = 11.54VHH178 pKa = 5.82TTGNSSAAIRR188 pKa = 11.84SDD190 pKa = 3.03RR191 pKa = 11.84GGGTEE196 pKa = 4.19NISGGTYY203 pKa = 8.13ITDD206 pKa = 5.21GIGSPVIYY214 pKa = 9.34STADD218 pKa = 3.21VTVSDD223 pKa = 4.1ATLEE227 pKa = 4.33STASQGVVVEE237 pKa = 4.74GKK239 pKa = 10.46NSVTLVDD246 pKa = 4.37CNLIASNTAKK256 pKa = 10.77NSDD259 pKa = 3.25KK260 pKa = 11.1SDD262 pKa = 2.84WYY264 pKa = 8.91QAVMIYY270 pKa = 10.81QSMSGDD276 pKa = 3.54AAEE279 pKa = 4.94GEE281 pKa = 4.47AFFTMEE287 pKa = 4.51GAASSIGTATFSSS300 pKa = 3.97
MM1 pKa = 7.14KK2 pKa = 10.2HH3 pKa = 6.14LRR5 pKa = 11.84TGIAACAVAVALAVGGCTGQADD27 pKa = 4.14EE28 pKa = 4.75TTSGTAEE35 pKa = 3.85QGTALDD41 pKa = 3.71QAGEE45 pKa = 4.38TEE47 pKa = 4.48RR48 pKa = 11.84SAEE51 pKa = 4.13EE52 pKa = 4.17PFSLTRR58 pKa = 11.84DD59 pKa = 3.44EE60 pKa = 5.11LVIDD64 pKa = 3.69EE65 pKa = 5.49TITDD69 pKa = 4.14DD70 pKa = 4.34ADD72 pKa = 3.36EE73 pKa = 4.25SHH75 pKa = 7.21AIIADD80 pKa = 3.7GTTEE84 pKa = 4.06SYY86 pKa = 11.02RR87 pKa = 11.84SIEE90 pKa = 4.11VVKK93 pKa = 10.2TGDD96 pKa = 3.57ADD98 pKa = 3.82GDD100 pKa = 3.94GADD103 pKa = 4.3FYY105 pKa = 10.88GTNAAVLATNGASLDD120 pKa = 3.9LADD123 pKa = 5.86SIVTSDD129 pKa = 3.4GTHH132 pKa = 6.29ANAVFSYY139 pKa = 11.54GEE141 pKa = 4.14GTVVNIAHH149 pKa = 6.8SIIEE153 pKa = 4.37TTGDD157 pKa = 3.4CSGGIMVTGGGTLNATDD174 pKa = 5.22LYY176 pKa = 11.54VHH178 pKa = 5.82TTGNSSAAIRR188 pKa = 11.84SDD190 pKa = 3.03RR191 pKa = 11.84GGGTEE196 pKa = 4.19NISGGTYY203 pKa = 8.13ITDD206 pKa = 5.21GIGSPVIYY214 pKa = 9.34STADD218 pKa = 3.21VTVSDD223 pKa = 4.1ATLEE227 pKa = 4.33STASQGVVVEE237 pKa = 4.74GKK239 pKa = 10.46NSVTLVDD246 pKa = 4.37CNLIASNTAKK256 pKa = 10.77NSDD259 pKa = 3.25KK260 pKa = 11.1SDD262 pKa = 2.84WYY264 pKa = 8.91QAVMIYY270 pKa = 10.81QSMSGDD276 pKa = 3.54AAEE279 pKa = 4.94GEE281 pKa = 4.47AFFTMEE287 pKa = 4.51GAASSIGTATFSSS300 pKa = 3.97
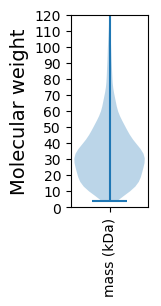
Molecular weight: 30.34 kDa
Isoelectric point according different methods:
Protein with the highest isoelectric point:
>tr|A0A437UTP7|A0A437UTP7_9ACTN LacI family transcriptional regulator OS=Coriobacteriales bacterium OH1046 OX=2491116 GN=EII22_08715 PE=4 SV=1
MM1 pKa = 7.35KK2 pKa = 9.42RR3 pKa = 11.84TYY5 pKa = 10.34QPNKK9 pKa = 8.62RR10 pKa = 11.84KK11 pKa = 9.56RR12 pKa = 11.84AKK14 pKa = 8.76THH16 pKa = 5.23GFRR19 pKa = 11.84ARR21 pKa = 11.84MATKK25 pKa = 10.11GGRR28 pKa = 11.84AVLSRR33 pKa = 11.84RR34 pKa = 11.84RR35 pKa = 11.84AKK37 pKa = 10.11GRR39 pKa = 11.84KK40 pKa = 8.89SLTVV44 pKa = 3.12
MM1 pKa = 7.35KK2 pKa = 9.42RR3 pKa = 11.84TYY5 pKa = 10.34QPNKK9 pKa = 8.62RR10 pKa = 11.84KK11 pKa = 9.56RR12 pKa = 11.84AKK14 pKa = 8.76THH16 pKa = 5.23GFRR19 pKa = 11.84ARR21 pKa = 11.84MATKK25 pKa = 10.11GGRR28 pKa = 11.84AVLSRR33 pKa = 11.84RR34 pKa = 11.84RR35 pKa = 11.84AKK37 pKa = 10.11GRR39 pKa = 11.84KK40 pKa = 8.89SLTVV44 pKa = 3.12
Molecular weight: 5.11 kDa
Isoelectric point according different methods:
Peptides (in silico digests for buttom-up proteomics)
Below you can find in silico digests of the whole proteome with Trypsin, Chymotrypsin, Trypsin+LysC, LysN, ArgC proteases suitable for different mass spec machines.| Try ESI |
 |
|---|
| ChTry ESI |
 |
|---|
| ArgC ESI |
 |
|---|
| LysN ESI |
 |
|---|
| TryLysC ESI |
 |
|---|
| Try MALDI |
 |
|---|
| ChTry MALDI |
 |
|---|
| ArgC MALDI |
 |
|---|
| LysN MALDI |
 |
|---|
| TryLysC MALDI |
 |
|---|
| Try LTQ |
 |
|---|
| ChTry LTQ |
 |
|---|
| ArgC LTQ |
 |
|---|
| LysN LTQ |
 |
|---|
| TryLysC LTQ |
 |
|---|
| Try MSlow |
 |
|---|
| ChTry MSlow |
 |
|---|
| ArgC MSlow |
 |
|---|
| LysN MSlow |
 |
|---|
| TryLysC MSlow |
 |
|---|
| Try MShigh |
 |
|---|
| ChTry MShigh |
 |
|---|
| ArgC MShigh |
 |
|---|
| LysN MShigh |
 |
|---|
| TryLysC MShigh |
 |
|---|
General Statistics
Number of major isoforms |
Number of additional isoforms |
Number of all proteins |
Number of amino acids |
Min. Seq. Length |
Max. Seq. Length |
Avg. Seq. Length |
Avg. Mol. Weight |
|---|---|---|---|---|---|---|---|
0 |
691650 |
33 |
2867 |
326.6 |
35.5 |
Amino acid frequency
Ala |
Cys |
Asp |
Glu |
Phe |
Gly |
His |
Ile |
Lys |
Leu |
|---|---|---|---|---|---|---|---|---|---|
11.508 ± 0.068 | 1.61 ± 0.022 |
6.253 ± 0.04 | 6.5 ± 0.049 |
3.686 ± 0.031 | 8.676 ± 0.047 |
1.974 ± 0.024 | 5.859 ± 0.045 |
3.253 ± 0.037 | 9.576 ± 0.06 |
Met |
Asn |
Gln |
Pro |
Arg |
Ser |
Thr |
Val |
Trp |
Tyr |
|---|---|---|---|---|---|---|---|---|---|
2.714 ± 0.028 | 2.589 ± 0.03 |
4.293 ± 0.03 | 2.537 ± 0.022 |
6.387 ± 0.055 | 5.982 ± 0.044 |
5.093 ± 0.06 | 7.473 ± 0.038 |
1.087 ± 0.019 | 2.951 ± 0.033 |
Most of the basic statistics you can see at this page can be downloaded from this CSV file
Proteome-pI is available under Creative Commons Attribution-NoDerivs license, for more details see here
| Reference: Kozlowski LP. Proteome-pI 2.0: Proteome Isoelectric Point Database Update. Nucleic Acids Res. 2021, doi: 10.1093/nar/gkab944 | Contact: Lukasz P. Kozlowski |
