Fibrobacter sp. UWEL
Taxonomy: cellular organisms; Bacteria; FCB group; Fibrobacteres; Fibrobacteria; Fibrobacterales; Fibrobacteraceae; Fibrobacter; unclassified Fibrobacter
Average proteome isoelectric point is 6.21
Get precalculated fractions of proteins

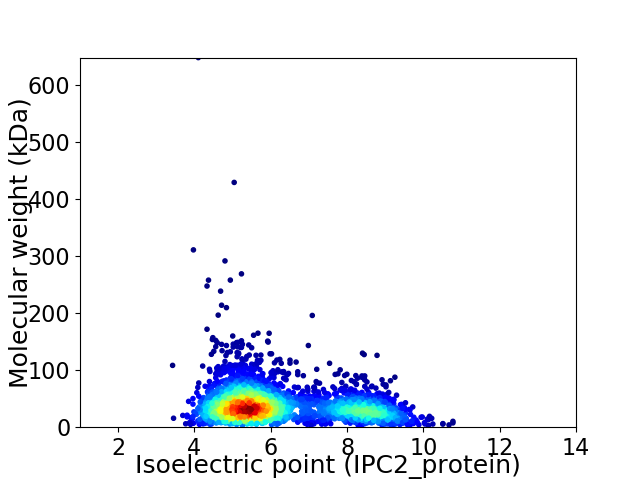
Virtual 2D-PAGE plot for 2928 proteins (isoelectric point calculated using IPC2_protein)
Get csv file with sequences according to given criteria:
* You can choose from 21 different methods for calculating isoelectric point
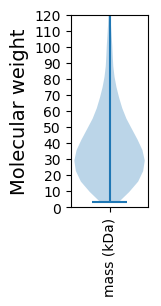
Summary statistics related to proteome-wise predictions


Protein with the lowest isoelectric point:
>tr|A0A1M6SFG6|A0A1M6SFG6_9BACT LexA repressor OS=Fibrobacter sp. UWEL OX=1896209 GN=lexA PE=3 SV=1
MM1 pKa = 7.7SYY3 pKa = 10.59NYY5 pKa = 10.16HH6 pKa = 7.03DD7 pKa = 5.65AIKK10 pKa = 9.71EE11 pKa = 4.03DD12 pKa = 4.27CEE14 pKa = 4.31TAIKK18 pKa = 10.31EE19 pKa = 4.01YY20 pKa = 10.9LDD22 pKa = 3.5YY23 pKa = 11.43HH24 pKa = 7.38KK25 pKa = 11.18DD26 pKa = 3.45EE27 pKa = 4.5VKK29 pKa = 10.79GMSKK33 pKa = 8.71EE34 pKa = 4.04TLTEE38 pKa = 4.02KK39 pKa = 10.54FHH41 pKa = 7.02DD42 pKa = 4.65AFWIDD47 pKa = 4.7DD48 pKa = 4.11SVTGNASGSYY58 pKa = 9.05TFSSYY63 pKa = 9.62EE64 pKa = 3.83AEE66 pKa = 4.14QNLAGNWDD74 pKa = 4.03LLGEE78 pKa = 4.28AMSEE82 pKa = 4.31FCCEE86 pKa = 3.65CDD88 pKa = 4.46AIAKK92 pKa = 8.26GAEE95 pKa = 4.03WADD98 pKa = 3.39VTIRR102 pKa = 11.84CYY104 pKa = 11.04LLDD107 pKa = 4.02EE108 pKa = 5.33GIEE111 pKa = 4.02KK112 pKa = 10.68AMEE115 pKa = 4.07EE116 pKa = 4.31LEE118 pKa = 4.15EE119 pKa = 5.59LIDD122 pKa = 3.82SAIEE126 pKa = 3.82EE127 pKa = 4.5SEE129 pKa = 4.22EE130 pKa = 3.89EE131 pKa = 4.37PEE133 pKa = 3.99EE134 pKa = 4.66SEE136 pKa = 4.46AA137 pKa = 4.93
MM1 pKa = 7.7SYY3 pKa = 10.59NYY5 pKa = 10.16HH6 pKa = 7.03DD7 pKa = 5.65AIKK10 pKa = 9.71EE11 pKa = 4.03DD12 pKa = 4.27CEE14 pKa = 4.31TAIKK18 pKa = 10.31EE19 pKa = 4.01YY20 pKa = 10.9LDD22 pKa = 3.5YY23 pKa = 11.43HH24 pKa = 7.38KK25 pKa = 11.18DD26 pKa = 3.45EE27 pKa = 4.5VKK29 pKa = 10.79GMSKK33 pKa = 8.71EE34 pKa = 4.04TLTEE38 pKa = 4.02KK39 pKa = 10.54FHH41 pKa = 7.02DD42 pKa = 4.65AFWIDD47 pKa = 4.7DD48 pKa = 4.11SVTGNASGSYY58 pKa = 9.05TFSSYY63 pKa = 9.62EE64 pKa = 3.83AEE66 pKa = 4.14QNLAGNWDD74 pKa = 4.03LLGEE78 pKa = 4.28AMSEE82 pKa = 4.31FCCEE86 pKa = 3.65CDD88 pKa = 4.46AIAKK92 pKa = 8.26GAEE95 pKa = 4.03WADD98 pKa = 3.39VTIRR102 pKa = 11.84CYY104 pKa = 11.04LLDD107 pKa = 4.02EE108 pKa = 5.33GIEE111 pKa = 4.02KK112 pKa = 10.68AMEE115 pKa = 4.07EE116 pKa = 4.31LEE118 pKa = 4.15EE119 pKa = 5.59LIDD122 pKa = 3.82SAIEE126 pKa = 3.82EE127 pKa = 4.5SEE129 pKa = 4.22EE130 pKa = 3.89EE131 pKa = 4.37PEE133 pKa = 3.99EE134 pKa = 4.66SEE136 pKa = 4.46AA137 pKa = 4.93
Molecular weight: 15.54 kDa
Isoelectric point according different methods:
Protein with the highest isoelectric point:
>tr|A0A1M7ARS9|A0A1M7ARS9_9BACT 50S ribosomal protein L3 OS=Fibrobacter sp. UWEL OX=1896209 GN=rplC PE=3 SV=1
MM1 pKa = 7.46ASKK4 pKa = 10.84RR5 pKa = 11.84MIEE8 pKa = 3.95KK9 pKa = 10.41CKK11 pKa = 9.75RR12 pKa = 11.84TPKK15 pKa = 9.04YY16 pKa = 8.5TVRR19 pKa = 11.84GYY21 pKa = 10.37NRR23 pKa = 11.84CKK25 pKa = 10.15RR26 pKa = 11.84CGRR29 pKa = 11.84PHH31 pKa = 7.62AFMRR35 pKa = 11.84RR36 pKa = 11.84FGLCRR41 pKa = 11.84ICFRR45 pKa = 11.84EE46 pKa = 3.78MALAGEE52 pKa = 4.53IPGITKK58 pKa = 10.48SSWW61 pKa = 2.78
MM1 pKa = 7.46ASKK4 pKa = 10.84RR5 pKa = 11.84MIEE8 pKa = 3.95KK9 pKa = 10.41CKK11 pKa = 9.75RR12 pKa = 11.84TPKK15 pKa = 9.04YY16 pKa = 8.5TVRR19 pKa = 11.84GYY21 pKa = 10.37NRR23 pKa = 11.84CKK25 pKa = 10.15RR26 pKa = 11.84CGRR29 pKa = 11.84PHH31 pKa = 7.62AFMRR35 pKa = 11.84RR36 pKa = 11.84FGLCRR41 pKa = 11.84ICFRR45 pKa = 11.84EE46 pKa = 3.78MALAGEE52 pKa = 4.53IPGITKK58 pKa = 10.48SSWW61 pKa = 2.78
Molecular weight: 7.19 kDa
Isoelectric point according different methods:
Peptides (in silico digests for buttom-up proteomics)
Below you can find in silico digests of the whole proteome with Trypsin, Chymotrypsin, Trypsin+LysC, LysN, ArgC proteases suitable for different mass spec machines.| Try ESI |
 |
|---|
| ChTry ESI |
 |
|---|
| ArgC ESI |
 |
|---|
| LysN ESI |
 |
|---|
| TryLysC ESI |
 |
|---|
| Try MALDI |
 |
|---|
| ChTry MALDI |
 |
|---|
| ArgC MALDI |
 |
|---|
| LysN MALDI |
 |
|---|
| TryLysC MALDI |
 |
|---|
| Try LTQ |
 |
|---|
| ChTry LTQ |
 |
|---|
| ArgC LTQ |
 |
|---|
| LysN LTQ |
 |
|---|
| TryLysC LTQ |
 |
|---|
| Try MSlow |
 |
|---|
| ChTry MSlow |
 |
|---|
| ArgC MSlow |
 |
|---|
| LysN MSlow |
 |
|---|
| TryLysC MSlow |
 |
|---|
| Try MShigh |
 |
|---|
| ChTry MShigh |
 |
|---|
| ArgC MShigh |
 |
|---|
| LysN MShigh |
 |
|---|
| TryLysC MShigh |
 |
|---|
General Statistics
Number of major isoforms |
Number of additional isoforms |
Number of all proteins |
Number of amino acids |
Min. Seq. Length |
Max. Seq. Length |
Avg. Seq. Length |
Avg. Mol. Weight |
|---|---|---|---|---|---|---|---|
0 |
1075629 |
26 |
6068 |
367.4 |
40.85 |
Amino acid frequency
Ala |
Cys |
Asp |
Glu |
Phe |
Gly |
His |
Ile |
Lys |
Leu |
|---|---|---|---|---|---|---|---|---|---|
8.42 ± 0.052 | 1.333 ± 0.021 |
6.024 ± 0.046 | 6.507 ± 0.039 |
4.702 ± 0.03 | 7.27 ± 0.045 |
1.726 ± 0.02 | 5.897 ± 0.038 |
6.642 ± 0.051 | 8.76 ± 0.044 |
Met |
Asn |
Gln |
Pro |
Arg |
Ser |
Thr |
Val |
Trp |
Tyr |
|---|---|---|---|---|---|---|---|---|---|
2.706 ± 0.02 | 4.683 ± 0.029 |
3.85 ± 0.029 | 3.063 ± 0.024 |
4.377 ± 0.037 | 6.759 ± 0.054 |
5.288 ± 0.039 | 7.113 ± 0.036 |
1.24 ± 0.016 | 3.639 ± 0.03 |
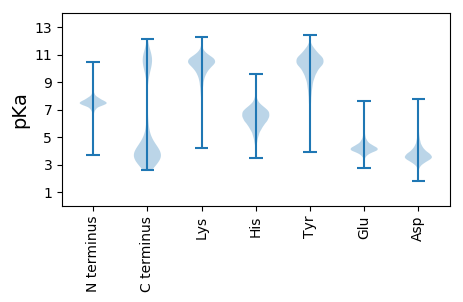
Most of the basic statistics you can see at this page can be downloaded from this CSV file
Proteome-pI is available under Creative Commons Attribution-NoDerivs license, for more details see here
| Reference: Kozlowski LP. Proteome-pI 2.0: Proteome Isoelectric Point Database Update. Nucleic Acids Res. 2021, doi: 10.1093/nar/gkab944 | Contact: Lukasz P. Kozlowski |
