Idiomarina sp. A28L
Taxonomy: cellular organisms; Bacteria; Proteobacteria; Gammaproteobacteria; Alteromonadales; Idiomarinaceae; Idiomarina; unclassified Idiomarina
Average proteome isoelectric point is 6.09
Get precalculated fractions of proteins

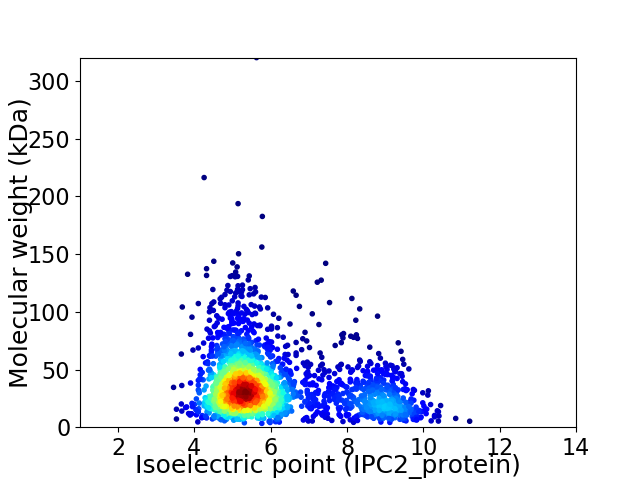
Virtual 2D-PAGE plot for 2298 proteins (isoelectric point calculated using IPC2_protein)
Get csv file with sequences according to given criteria:
* You can choose from 21 different methods for calculating isoelectric point
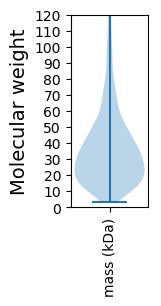
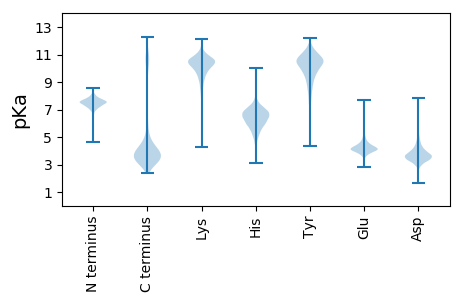
Summary statistics related to proteome-wise predictions


Protein with the lowest isoelectric point:
>tr|F7RZ01|F7RZ01_9GAMM P-type ATPase translocating P-type ATPase translocating OS=Idiomarina sp. A28L OX=1036674 GN=A28LD_1487 PE=4 SV=1
MM1 pKa = 7.11MKK3 pKa = 9.97INSFLLPVVSAGMLVFAAQADD24 pKa = 4.08TVYY27 pKa = 10.53TSDD30 pKa = 4.15SSVTAYY36 pKa = 10.78DD37 pKa = 4.21PIFPSTAYY45 pKa = 10.7SDD47 pKa = 3.76WVNQACTINPDD58 pKa = 3.11VGLDD62 pKa = 3.67ADD64 pKa = 4.37WEE66 pKa = 4.51NPHH69 pKa = 7.13PSYY72 pKa = 11.22QFGTNVHH79 pKa = 6.69PWQSGSFLNAQWINAWSDD97 pKa = 2.84INARR101 pKa = 11.84GPLGQSWTKK110 pKa = 10.48YY111 pKa = 6.76STEE114 pKa = 3.55ISGQGEE120 pKa = 4.14FVLDD124 pKa = 4.55LLADD128 pKa = 3.8NCSWIYY134 pKa = 10.59IDD136 pKa = 3.53GTLVGFQAVTSLAQKK151 pKa = 10.9YY152 pKa = 8.59PVTLNGDD159 pKa = 3.39HH160 pKa = 6.67TLDD163 pKa = 3.83FLIFDD168 pKa = 4.57GGGLAGGMFRR178 pKa = 11.84LEE180 pKa = 4.47TNTGTVFVDD189 pKa = 3.44SDD191 pKa = 3.82NDD193 pKa = 3.76GLTDD197 pKa = 4.52AEE199 pKa = 4.18EE200 pKa = 4.21ALYY203 pKa = 8.52GTDD206 pKa = 4.11PLNPDD211 pKa = 3.14SDD213 pKa = 4.16GDD215 pKa = 3.96GFTDD219 pKa = 4.11GEE221 pKa = 4.26EE222 pKa = 4.3VAAGTDD228 pKa = 3.64PNDD231 pKa = 4.09PNDD234 pKa = 3.84FPVFDD239 pKa = 4.25TDD241 pKa = 5.55GDD243 pKa = 4.62GVWDD247 pKa = 5.0IDD249 pKa = 4.05DD250 pKa = 4.39ACPNTSEE257 pKa = 4.69GVLVDD262 pKa = 3.41QFGCSGVQNIALACSCEE279 pKa = 4.05GSDD282 pKa = 6.12DD283 pKa = 3.67NSPWKK288 pKa = 10.72NHH290 pKa = 4.64GQYY293 pKa = 10.38VSCVAKK299 pKa = 10.74AKK301 pKa = 10.74NNEE304 pKa = 4.07VNNGLITEE312 pKa = 4.52AEE314 pKa = 4.22GSEE317 pKa = 4.28LVSAAAQSSCGKK329 pKa = 9.81RR330 pKa = 11.84DD331 pKa = 3.41NGNKK335 pKa = 9.78GKK337 pKa = 10.41NKK339 pKa = 10.28
MM1 pKa = 7.11MKK3 pKa = 9.97INSFLLPVVSAGMLVFAAQADD24 pKa = 4.08TVYY27 pKa = 10.53TSDD30 pKa = 4.15SSVTAYY36 pKa = 10.78DD37 pKa = 4.21PIFPSTAYY45 pKa = 10.7SDD47 pKa = 3.76WVNQACTINPDD58 pKa = 3.11VGLDD62 pKa = 3.67ADD64 pKa = 4.37WEE66 pKa = 4.51NPHH69 pKa = 7.13PSYY72 pKa = 11.22QFGTNVHH79 pKa = 6.69PWQSGSFLNAQWINAWSDD97 pKa = 2.84INARR101 pKa = 11.84GPLGQSWTKK110 pKa = 10.48YY111 pKa = 6.76STEE114 pKa = 3.55ISGQGEE120 pKa = 4.14FVLDD124 pKa = 4.55LLADD128 pKa = 3.8NCSWIYY134 pKa = 10.59IDD136 pKa = 3.53GTLVGFQAVTSLAQKK151 pKa = 10.9YY152 pKa = 8.59PVTLNGDD159 pKa = 3.39HH160 pKa = 6.67TLDD163 pKa = 3.83FLIFDD168 pKa = 4.57GGGLAGGMFRR178 pKa = 11.84LEE180 pKa = 4.47TNTGTVFVDD189 pKa = 3.44SDD191 pKa = 3.82NDD193 pKa = 3.76GLTDD197 pKa = 4.52AEE199 pKa = 4.18EE200 pKa = 4.21ALYY203 pKa = 8.52GTDD206 pKa = 4.11PLNPDD211 pKa = 3.14SDD213 pKa = 4.16GDD215 pKa = 3.96GFTDD219 pKa = 4.11GEE221 pKa = 4.26EE222 pKa = 4.3VAAGTDD228 pKa = 3.64PNDD231 pKa = 4.09PNDD234 pKa = 3.84FPVFDD239 pKa = 4.25TDD241 pKa = 5.55GDD243 pKa = 4.62GVWDD247 pKa = 5.0IDD249 pKa = 4.05DD250 pKa = 4.39ACPNTSEE257 pKa = 4.69GVLVDD262 pKa = 3.41QFGCSGVQNIALACSCEE279 pKa = 4.05GSDD282 pKa = 6.12DD283 pKa = 3.67NSPWKK288 pKa = 10.72NHH290 pKa = 4.64GQYY293 pKa = 10.38VSCVAKK299 pKa = 10.74AKK301 pKa = 10.74NNEE304 pKa = 4.07VNNGLITEE312 pKa = 4.52AEE314 pKa = 4.22GSEE317 pKa = 4.28LVSAAAQSSCGKK329 pKa = 9.81RR330 pKa = 11.84DD331 pKa = 3.41NGNKK335 pKa = 9.78GKK337 pKa = 10.41NKK339 pKa = 10.28
Molecular weight: 36.15 kDa
Isoelectric point according different methods:
Protein with the highest isoelectric point:
>tr|F7RWD3|F7RWD3_9GAMM tRNA uridine 5-carboxymethylaminomethyl modification enzyme MnmG OS=Idiomarina sp. A28L OX=1036674 GN=mnmG PE=3 SV=1
MM1 pKa = 7.45KK2 pKa = 9.51RR3 pKa = 11.84TFQPSVLKK11 pKa = 10.49RR12 pKa = 11.84KK13 pKa = 7.97RR14 pKa = 11.84THH16 pKa = 5.89GFRR19 pKa = 11.84ARR21 pKa = 11.84MATKK25 pKa = 10.4NGRR28 pKa = 11.84QVLARR33 pKa = 11.84RR34 pKa = 11.84RR35 pKa = 11.84AKK37 pKa = 10.2GRR39 pKa = 11.84KK40 pKa = 8.31QLAAA44 pKa = 4.14
MM1 pKa = 7.45KK2 pKa = 9.51RR3 pKa = 11.84TFQPSVLKK11 pKa = 10.49RR12 pKa = 11.84KK13 pKa = 7.97RR14 pKa = 11.84THH16 pKa = 5.89GFRR19 pKa = 11.84ARR21 pKa = 11.84MATKK25 pKa = 10.4NGRR28 pKa = 11.84QVLARR33 pKa = 11.84RR34 pKa = 11.84RR35 pKa = 11.84AKK37 pKa = 10.2GRR39 pKa = 11.84KK40 pKa = 8.31QLAAA44 pKa = 4.14
Molecular weight: 5.16 kDa
Isoelectric point according different methods:
Peptides (in silico digests for buttom-up proteomics)
Below you can find in silico digests of the whole proteome with Trypsin, Chymotrypsin, Trypsin+LysC, LysN, ArgC proteases suitable for different mass spec machines.| Try ESI |
 |
|---|
| ChTry ESI |
 |
|---|
| ArgC ESI |
 |
|---|
| LysN ESI |
 |
|---|
| TryLysC ESI |
 |
|---|
| Try MALDI |
 |
|---|
| ChTry MALDI |
 |
|---|
| ArgC MALDI |
 |
|---|
| LysN MALDI |
 |
|---|
| TryLysC MALDI |
 |
|---|
| Try LTQ |
 |
|---|
| ChTry LTQ |
 |
|---|
| ArgC LTQ |
 |
|---|
| LysN LTQ |
 |
|---|
| TryLysC LTQ |
 |
|---|
| Try MSlow |
 |
|---|
| ChTry MSlow |
 |
|---|
| ArgC MSlow |
 |
|---|
| LysN MSlow |
 |
|---|
| TryLysC MSlow |
 |
|---|
| Try MShigh |
 |
|---|
| ChTry MShigh |
 |
|---|
| ArgC MShigh |
 |
|---|
| LysN MShigh |
 |
|---|
| TryLysC MShigh |
 |
|---|
General Statistics
Number of major isoforms |
Number of additional isoforms |
Number of all proteins |
Number of amino acids |
Min. Seq. Length |
Max. Seq. Length |
Avg. Seq. Length |
Avg. Mol. Weight |
|---|---|---|---|---|---|---|---|
0 |
783584 |
29 |
2854 |
341.0 |
37.8 |
Amino acid frequency
Ala |
Cys |
Asp |
Glu |
Phe |
Gly |
His |
Ile |
Lys |
Leu |
|---|---|---|---|---|---|---|---|---|---|
9.787 ± 0.05 | 0.834 ± 0.015 |
5.243 ± 0.04 | 6.72 ± 0.05 |
4.079 ± 0.03 | 7.052 ± 0.044 |
2.227 ± 0.029 | 6.03 ± 0.038 |
4.123 ± 0.049 | 10.411 ± 0.066 |
Met |
Asn |
Gln |
Pro |
Arg |
Ser |
Thr |
Val |
Trp |
Tyr |
|---|---|---|---|---|---|---|---|---|---|
2.485 ± 0.025 | 4.122 ± 0.029 |
4.157 ± 0.031 | 4.608 ± 0.039 |
5.674 ± 0.042 | 6.154 ± 0.041 |
5.114 ± 0.039 | 7.053 ± 0.04 |
1.291 ± 0.02 | 2.834 ± 0.024 |
Most of the basic statistics you can see at this page can be downloaded from this CSV file
Proteome-pI is available under Creative Commons Attribution-NoDerivs license, for more details see here
| Reference: Kozlowski LP. Proteome-pI 2.0: Proteome Isoelectric Point Database Update. Nucleic Acids Res. 2021, doi: 10.1093/nar/gkab944 | Contact: Lukasz P. Kozlowski |
