Lachancea thermotolerans (strain ATCC 56472 / CBS 6340 / NRRL Y-8284) (Yeast) (Kluyveromyces thermotolerans)
Taxonomy: cellular organisms; Eukaryota; Opisthokonta; Fungi; Dikarya; Ascomycota; saccharomyceta; Saccharomycotina; Saccharomycetes; Saccharomycetales; Saccharomycetaceae; Lachancea; Lachancea thermotolerans
Average proteome isoelectric point is 6.58
Get precalculated fractions of proteins

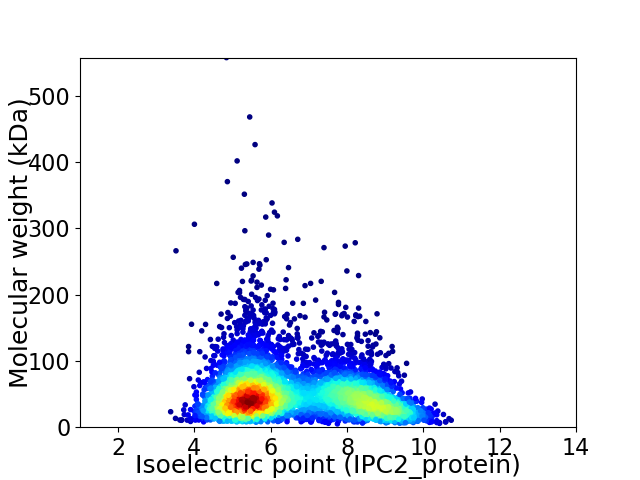
Virtual 2D-PAGE plot for 5093 proteins (isoelectric point calculated using IPC2_protein)
Get csv file with sequences according to given criteria:
* You can choose from 21 different methods for calculating isoelectric point
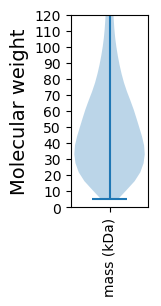
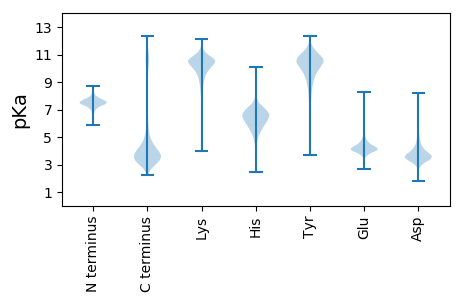
Summary statistics related to proteome-wise predictions


Protein with the lowest isoelectric point:
>tr|C5DFQ3|C5DFQ3_LACTC KLTH0D17006p OS=Lachancea thermotolerans (strain ATCC 56472 / CBS 6340 / NRRL Y-8284) OX=559295 GN=KLTH0D17006g PE=4 SV=1
MM1 pKa = 7.38KK2 pKa = 10.4FSVLFSVFCASVASGMCIVRR22 pKa = 11.84FDD24 pKa = 3.64QDD26 pKa = 3.24FPIPVDD32 pKa = 3.35TTQPVGDD39 pKa = 4.61FMCNHH44 pKa = 6.8AEE46 pKa = 3.81LWLHH50 pKa = 6.05KK51 pKa = 10.26FSNGTVALEE60 pKa = 4.57SIDD63 pKa = 4.34DD64 pKa = 3.81NSIVQIIPDD73 pKa = 4.05DD74 pKa = 3.88SVFAQTAEE82 pKa = 3.99DD83 pKa = 3.59SGYY86 pKa = 10.73LQSTDD91 pKa = 4.05DD92 pKa = 6.36DD93 pKa = 4.05EE94 pKa = 6.37LEE96 pKa = 4.04WAPAA100 pKa = 3.51
MM1 pKa = 7.38KK2 pKa = 10.4FSVLFSVFCASVASGMCIVRR22 pKa = 11.84FDD24 pKa = 3.64QDD26 pKa = 3.24FPIPVDD32 pKa = 3.35TTQPVGDD39 pKa = 4.61FMCNHH44 pKa = 6.8AEE46 pKa = 3.81LWLHH50 pKa = 6.05KK51 pKa = 10.26FSNGTVALEE60 pKa = 4.57SIDD63 pKa = 4.34DD64 pKa = 3.81NSIVQIIPDD73 pKa = 4.05DD74 pKa = 3.88SVFAQTAEE82 pKa = 3.99DD83 pKa = 3.59SGYY86 pKa = 10.73LQSTDD91 pKa = 4.05DD92 pKa = 6.36DD93 pKa = 4.05EE94 pKa = 6.37LEE96 pKa = 4.04WAPAA100 pKa = 3.51
Molecular weight: 11.04 kDa
Isoelectric point according different methods:
Protein with the highest isoelectric point:
>tr|C5DME9|C5DME9_LACTC KLTH0G08294p OS=Lachancea thermotolerans (strain ATCC 56472 / CBS 6340 / NRRL Y-8284) OX=559295 GN=KLTH0G08294g PE=4 SV=1
MM1 pKa = 7.69RR2 pKa = 11.84AEE4 pKa = 4.43CRR6 pKa = 11.84RR7 pKa = 11.84KK8 pKa = 10.19DD9 pKa = 3.59VTSVEE14 pKa = 4.44PSTKK18 pKa = 9.83QAVARR23 pKa = 11.84APDD26 pKa = 3.63PRR28 pKa = 11.84RR29 pKa = 11.84IWACGSGAGRR39 pKa = 11.84TAGRR43 pKa = 11.84PSEE46 pKa = 4.27CMRR49 pKa = 11.84ASDD52 pKa = 3.92GAPVSRR58 pKa = 11.84RR59 pKa = 11.84RR60 pKa = 11.84RR61 pKa = 11.84ARR63 pKa = 11.84GARR66 pKa = 11.84RR67 pKa = 11.84SSWMVTDD74 pKa = 2.87VHH76 pKa = 7.46VCITCAQEE84 pKa = 5.2ALDD87 pKa = 4.22EE88 pKa = 4.58SPSAFLLSNRR98 pKa = 11.84RR99 pKa = 11.84YY100 pKa = 10.14NISTARR106 pKa = 11.84ASEE109 pKa = 4.45GPLRR113 pKa = 11.84STLARR118 pKa = 11.84ARR120 pKa = 11.84CFPKK124 pKa = 10.53ANRR127 pKa = 11.84GAVDD131 pKa = 4.07FVYY134 pKa = 10.98GDD136 pKa = 3.64SDD138 pKa = 4.07YY139 pKa = 11.58KK140 pKa = 11.18GAVTNVFVYY149 pKa = 8.79FRR151 pKa = 11.84PFAPGTHH158 pKa = 5.02VFKK161 pKa = 10.72IASQLVFQKK170 pKa = 10.12MIYY173 pKa = 9.16KK174 pKa = 9.85ICGFLRR180 pKa = 11.84KK181 pKa = 9.63LWAA184 pKa = 4.52
MM1 pKa = 7.69RR2 pKa = 11.84AEE4 pKa = 4.43CRR6 pKa = 11.84RR7 pKa = 11.84KK8 pKa = 10.19DD9 pKa = 3.59VTSVEE14 pKa = 4.44PSTKK18 pKa = 9.83QAVARR23 pKa = 11.84APDD26 pKa = 3.63PRR28 pKa = 11.84RR29 pKa = 11.84IWACGSGAGRR39 pKa = 11.84TAGRR43 pKa = 11.84PSEE46 pKa = 4.27CMRR49 pKa = 11.84ASDD52 pKa = 3.92GAPVSRR58 pKa = 11.84RR59 pKa = 11.84RR60 pKa = 11.84RR61 pKa = 11.84ARR63 pKa = 11.84GARR66 pKa = 11.84RR67 pKa = 11.84SSWMVTDD74 pKa = 2.87VHH76 pKa = 7.46VCITCAQEE84 pKa = 5.2ALDD87 pKa = 4.22EE88 pKa = 4.58SPSAFLLSNRR98 pKa = 11.84RR99 pKa = 11.84YY100 pKa = 10.14NISTARR106 pKa = 11.84ASEE109 pKa = 4.45GPLRR113 pKa = 11.84STLARR118 pKa = 11.84ARR120 pKa = 11.84CFPKK124 pKa = 10.53ANRR127 pKa = 11.84GAVDD131 pKa = 4.07FVYY134 pKa = 10.98GDD136 pKa = 3.64SDD138 pKa = 4.07YY139 pKa = 11.58KK140 pKa = 11.18GAVTNVFVYY149 pKa = 8.79FRR151 pKa = 11.84PFAPGTHH158 pKa = 5.02VFKK161 pKa = 10.72IASQLVFQKK170 pKa = 10.12MIYY173 pKa = 9.16KK174 pKa = 9.85ICGFLRR180 pKa = 11.84KK181 pKa = 9.63LWAA184 pKa = 4.52
Molecular weight: 20.47 kDa
Isoelectric point according different methods:
Peptides (in silico digests for buttom-up proteomics)
Below you can find in silico digests of the whole proteome with Trypsin, Chymotrypsin, Trypsin+LysC, LysN, ArgC proteases suitable for different mass spec machines.| Try ESI |
 |
|---|
| ChTry ESI |
 |
|---|
| ArgC ESI |
 |
|---|
| LysN ESI |
 |
|---|
| TryLysC ESI |
 |
|---|
| Try MALDI |
 |
|---|
| ChTry MALDI |
 |
|---|
| ArgC MALDI |
 |
|---|
| LysN MALDI |
 |
|---|
| TryLysC MALDI |
 |
|---|
| Try LTQ |
 |
|---|
| ChTry LTQ |
 |
|---|
| ArgC LTQ |
 |
|---|
| LysN LTQ |
 |
|---|
| TryLysC LTQ |
 |
|---|
| Try MSlow |
 |
|---|
| ChTry MSlow |
 |
|---|
| ArgC MSlow |
 |
|---|
| LysN MSlow |
 |
|---|
| TryLysC MSlow |
 |
|---|
| Try MShigh |
 |
|---|
| ChTry MShigh |
 |
|---|
| ArgC MShigh |
 |
|---|
| LysN MShigh |
 |
|---|
| TryLysC MShigh |
 |
|---|
General Statistics
Number of major isoforms |
Number of additional isoforms |
Number of all proteins |
Number of amino acids |
Min. Seq. Length |
Max. Seq. Length |
Avg. Seq. Length |
Avg. Mol. Weight |
|---|---|---|---|---|---|---|---|
0 |
2500247 |
48 |
4928 |
490.9 |
55.01 |
Amino acid frequency
Ala |
Cys |
Asp |
Glu |
Phe |
Gly |
His |
Ile |
Lys |
Leu |
|---|---|---|---|---|---|---|---|---|---|
7.039 ± 0.028 | 1.34 ± 0.014 |
5.591 ± 0.024 | 6.762 ± 0.033 |
4.382 ± 0.022 | 5.676 ± 0.028 |
2.193 ± 0.015 | 5.298 ± 0.026 |
6.489 ± 0.032 | 9.79 ± 0.033 |
Met |
Asn |
Gln |
Pro |
Arg |
Ser |
Thr |
Val |
Trp |
Tyr |
|---|---|---|---|---|---|---|---|---|---|
2.016 ± 0.011 | 4.62 ± 0.023 |
4.658 ± 0.027 | 4.234 ± 0.026 |
5.107 ± 0.027 | 9.004 ± 0.044 |
5.423 ± 0.047 | 6.214 ± 0.025 |
1.091 ± 0.01 | 3.075 ± 0.016 |
Most of the basic statistics you can see at this page can be downloaded from this CSV file
Proteome-pI is available under Creative Commons Attribution-NoDerivs license, for more details see here
| Reference: Kozlowski LP. Proteome-pI 2.0: Proteome Isoelectric Point Database Update. Nucleic Acids Res. 2021, doi: 10.1093/nar/gkab944 | Contact: Lukasz P. Kozlowski |
