Geoalkalibacter subterraneus
Taxonomy: cellular organisms; Bacteria; Proteobacteria; delta/epsilon subdivisions; Deltaproteobacteria; Desulfuromonadales; Geobacteraceae; Geoalkalibacter
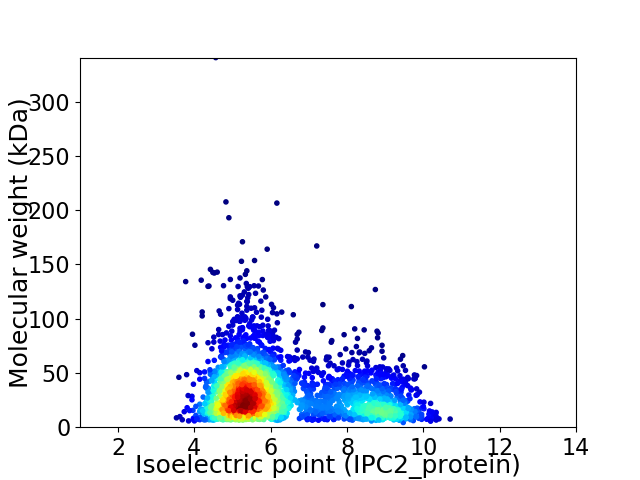
Average proteome isoelectric point is 6.3
Get precalculated fractions of proteins

Virtual 2D-PAGE plot for 2987 proteins (isoelectric point calculated using IPC2_protein)
Get csv file with sequences according to given criteria:
* You can choose from 21 different methods for calculating isoelectric point
Summary statistics related to proteome-wise predictions


Protein with the lowest isoelectric point:
>tr|A0A0B5FLH5|A0A0B5FLH5_9DELT Uncharacterized protein OS=Geoalkalibacter subterraneus OX=483547 GN=GSUB_17585 PE=4 SV=1
MM1 pKa = 7.19SRR3 pKa = 11.84RR4 pKa = 11.84YY5 pKa = 9.88LVTANVSFFVDD16 pKa = 4.32LPYY19 pKa = 10.39PEE21 pKa = 5.71NMADD25 pKa = 4.62DD26 pKa = 4.64QDD28 pKa = 4.45LQDD31 pKa = 5.54LVCCDD36 pKa = 4.02PQGEE40 pKa = 4.44MTDD43 pKa = 3.56AEE45 pKa = 4.42AVEE48 pKa = 4.67SAVTTAIRR56 pKa = 11.84YY57 pKa = 9.6CEE59 pKa = 3.94VFVYY63 pKa = 11.05GEE65 pKa = 4.2DD66 pKa = 3.87VEE68 pKa = 4.68PAQCRR73 pKa = 11.84VDD75 pKa = 4.71DD76 pKa = 3.43IDD78 pKa = 3.55MRR80 pKa = 11.84IEE82 pKa = 4.13GFEE85 pKa = 4.05DD86 pKa = 3.17
MM1 pKa = 7.19SRR3 pKa = 11.84RR4 pKa = 11.84YY5 pKa = 9.88LVTANVSFFVDD16 pKa = 4.32LPYY19 pKa = 10.39PEE21 pKa = 5.71NMADD25 pKa = 4.62DD26 pKa = 4.64QDD28 pKa = 4.45LQDD31 pKa = 5.54LVCCDD36 pKa = 4.02PQGEE40 pKa = 4.44MTDD43 pKa = 3.56AEE45 pKa = 4.42AVEE48 pKa = 4.67SAVTTAIRR56 pKa = 11.84YY57 pKa = 9.6CEE59 pKa = 3.94VFVYY63 pKa = 11.05GEE65 pKa = 4.2DD66 pKa = 3.87VEE68 pKa = 4.68PAQCRR73 pKa = 11.84VDD75 pKa = 4.71DD76 pKa = 3.43IDD78 pKa = 3.55MRR80 pKa = 11.84IEE82 pKa = 4.13GFEE85 pKa = 4.05DD86 pKa = 3.17
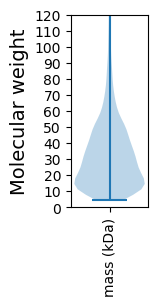
Molecular weight: 9.77 kDa
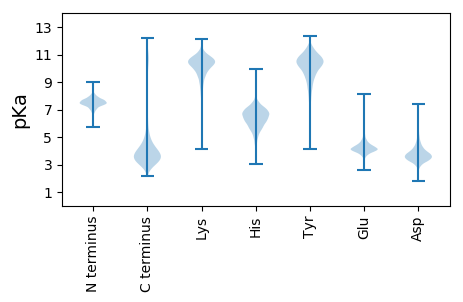
Isoelectric point according different methods:
Protein with the highest isoelectric point:
>tr|A0A0B5FNF8|A0A0B5FNF8_9DELT Uncharacterized protein OS=Geoalkalibacter subterraneus OX=483547 GN=GSUB_05695 PE=4 SV=1
MM1 pKa = 7.88AEE3 pKa = 3.38IRR5 pKa = 11.84AFIAVPLSEE14 pKa = 4.99KK15 pKa = 10.56NLAAIRR21 pKa = 11.84DD22 pKa = 3.73LRR24 pKa = 11.84RR25 pKa = 11.84RR26 pKa = 11.84IEE28 pKa = 3.63PRR30 pKa = 11.84YY31 pKa = 8.84PQMRR35 pKa = 11.84WVRR38 pKa = 11.84TDD40 pKa = 3.47DD41 pKa = 4.11QIHH44 pKa = 5.31LTLRR48 pKa = 11.84FFAALPEE55 pKa = 4.22EE56 pKa = 4.58DD57 pKa = 4.52LDD59 pKa = 4.96RR60 pKa = 11.84IHH62 pKa = 7.32EE63 pKa = 4.44SMLSVGDD70 pKa = 3.9LNAPFSVKK78 pKa = 9.68IRR80 pKa = 11.84GLGGFPRR87 pKa = 11.84LNRR90 pKa = 11.84PRR92 pKa = 11.84VLWLGLEE99 pKa = 4.16PSAPLVALHH108 pKa = 6.55RR109 pKa = 11.84RR110 pKa = 11.84LEE112 pKa = 4.23GALRR116 pKa = 11.84RR117 pKa = 11.84EE118 pKa = 4.25GFAPEE123 pKa = 4.06EE124 pKa = 4.28RR125 pKa = 11.84PFTPHH130 pKa = 4.32VTLARR135 pKa = 11.84ARR137 pKa = 11.84RR138 pKa = 11.84RR139 pKa = 11.84GGEE142 pKa = 4.13EE143 pKa = 3.47IKK145 pKa = 10.68PPAWGRR151 pKa = 11.84SWCGGSLDD159 pKa = 3.66VNEE162 pKa = 5.09IILYY166 pKa = 10.01HH167 pKa = 6.63SRR169 pKa = 11.84LNPQGAVHH177 pKa = 6.23TPLYY181 pKa = 10.39RR182 pKa = 11.84VGLNGTSSQKK192 pKa = 8.98EE193 pKa = 3.85HH194 pKa = 6.3HH195 pKa = 6.11TT196 pKa = 3.76
MM1 pKa = 7.88AEE3 pKa = 3.38IRR5 pKa = 11.84AFIAVPLSEE14 pKa = 4.99KK15 pKa = 10.56NLAAIRR21 pKa = 11.84DD22 pKa = 3.73LRR24 pKa = 11.84RR25 pKa = 11.84RR26 pKa = 11.84IEE28 pKa = 3.63PRR30 pKa = 11.84YY31 pKa = 8.84PQMRR35 pKa = 11.84WVRR38 pKa = 11.84TDD40 pKa = 3.47DD41 pKa = 4.11QIHH44 pKa = 5.31LTLRR48 pKa = 11.84FFAALPEE55 pKa = 4.22EE56 pKa = 4.58DD57 pKa = 4.52LDD59 pKa = 4.96RR60 pKa = 11.84IHH62 pKa = 7.32EE63 pKa = 4.44SMLSVGDD70 pKa = 3.9LNAPFSVKK78 pKa = 9.68IRR80 pKa = 11.84GLGGFPRR87 pKa = 11.84LNRR90 pKa = 11.84PRR92 pKa = 11.84VLWLGLEE99 pKa = 4.16PSAPLVALHH108 pKa = 6.55RR109 pKa = 11.84RR110 pKa = 11.84LEE112 pKa = 4.23GALRR116 pKa = 11.84RR117 pKa = 11.84EE118 pKa = 4.25GFAPEE123 pKa = 4.06EE124 pKa = 4.28RR125 pKa = 11.84PFTPHH130 pKa = 4.32VTLARR135 pKa = 11.84ARR137 pKa = 11.84RR138 pKa = 11.84RR139 pKa = 11.84GGEE142 pKa = 4.13EE143 pKa = 3.47IKK145 pKa = 10.68PPAWGRR151 pKa = 11.84SWCGGSLDD159 pKa = 3.66VNEE162 pKa = 5.09IILYY166 pKa = 10.01HH167 pKa = 6.63SRR169 pKa = 11.84LNPQGAVHH177 pKa = 6.23TPLYY181 pKa = 10.39RR182 pKa = 11.84VGLNGTSSQKK192 pKa = 8.98EE193 pKa = 3.85HH194 pKa = 6.3HH195 pKa = 6.11TT196 pKa = 3.76
Molecular weight: 22.35 kDa
Isoelectric point according different methods:
Peptides (in silico digests for buttom-up proteomics)
Below you can find in silico digests of the whole proteome with Trypsin, Chymotrypsin, Trypsin+LysC, LysN, ArgC proteases suitable for different mass spec machines.| Try ESI |
 |
|---|
| ChTry ESI |
 |
|---|
| ArgC ESI |
 |
|---|
| LysN ESI |
 |
|---|
| TryLysC ESI |
 |
|---|
| Try MALDI |
 |
|---|
| ChTry MALDI |
 |
|---|
| ArgC MALDI |
 |
|---|
| LysN MALDI |
 |
|---|
| TryLysC MALDI |
 |
|---|
| Try LTQ |
 |
|---|
| ChTry LTQ |
 |
|---|
| ArgC LTQ |
 |
|---|
| LysN LTQ |
 |
|---|
| TryLysC LTQ |
 |
|---|
| Try MSlow |
 |
|---|
| ChTry MSlow |
 |
|---|
| ArgC MSlow |
 |
|---|
| LysN MSlow |
 |
|---|
| TryLysC MSlow |
 |
|---|
| Try MShigh |
 |
|---|
| ChTry MShigh |
 |
|---|
| ArgC MShigh |
 |
|---|
| LysN MShigh |
 |
|---|
| TryLysC MShigh |
 |
|---|
General Statistics
Number of major isoforms |
Number of additional isoforms |
Number of all proteins |
Number of amino acids |
Min. Seq. Length |
Max. Seq. Length |
Avg. Seq. Length |
Avg. Mol. Weight |
|---|---|---|---|---|---|---|---|
0 |
924840 |
37 |
3246 |
309.6 |
34.37 |
Amino acid frequency
Ala |
Cys |
Asp |
Glu |
Phe |
Gly |
His |
Ile |
Lys |
Leu |
|---|---|---|---|---|---|---|---|---|---|
9.222 ± 0.053 | 1.281 ± 0.029 |
5.814 ± 0.038 | 7.127 ± 0.05 |
4.078 ± 0.035 | 7.824 ± 0.042 |
2.264 ± 0.028 | 5.535 ± 0.043 |
4.318 ± 0.049 | 10.559 ± 0.06 |
Met |
Asn |
Gln |
Pro |
Arg |
Ser |
Thr |
Val |
Trp |
Tyr |
|---|---|---|---|---|---|---|---|---|---|
2.392 ± 0.024 | 3.072 ± 0.031 |
4.605 ± 0.031 | 3.748 ± 0.028 |
7.004 ± 0.055 | 5.512 ± 0.042 |
4.831 ± 0.034 | 7.132 ± 0.039 |
1.08 ± 0.021 | 2.601 ± 0.028 |
Most of the basic statistics you can see at this page can be downloaded from this CSV file
Proteome-pI is available under Creative Commons Attribution-NoDerivs license, for more details see here
| Reference: Kozlowski LP. Proteome-pI 2.0: Proteome Isoelectric Point Database Update. Nucleic Acids Res. 2021, doi: 10.1093/nar/gkab944 | Contact: Lukasz P. Kozlowski |
