Xanthomonas phage phiLf2
Taxonomy: Viruses; Monodnaviria; Loebvirae; Hofneiviricota; Faserviricetes; Tubulavirales; Inoviridae; unclassified Inoviridae
Average proteome isoelectric point is 7.2
Get precalculated fractions of proteins

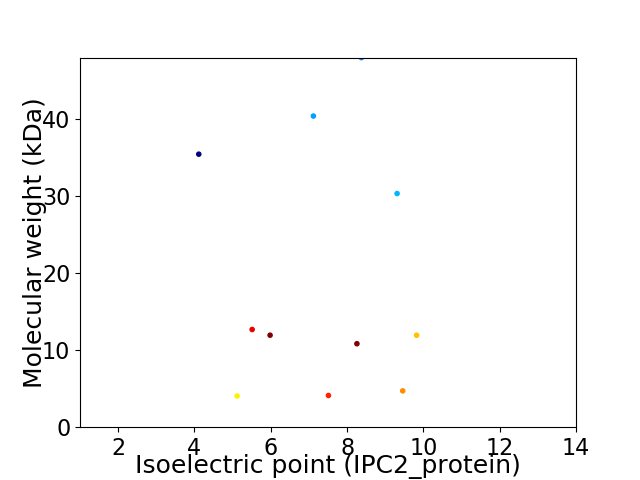
Virtual 2D-PAGE plot for 11 proteins (isoelectric point calculated using IPC2_protein)
Get csv file with sequences according to given criteria:
* You can choose from 21 different methods for calculating isoelectric point
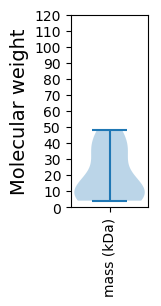
Summary statistics related to proteome-wise predictions


Protein with the lowest isoelectric point:
>tr|A0A2Z4QIJ4|A0A2Z4QIJ4_9VIRU Minor coat protein OS=Xanthomonas phage phiLf2 OX=2201344 GN=phiLf2_ORF6 PE=4 SV=1
MM1 pKa = 7.78WIHH4 pKa = 5.63GRR6 pKa = 11.84AVRR9 pKa = 11.84LGRR12 pKa = 11.84RR13 pKa = 11.84QGVGCVRR20 pKa = 11.84YY21 pKa = 9.07IVVVALCLAALFFSSRR37 pKa = 11.84VSAACVQLEE46 pKa = 4.32APTSSHH52 pKa = 6.46NGDD55 pKa = 3.59WSCADD60 pKa = 3.25QGEE63 pKa = 4.4AFAKK67 pKa = 10.28VSSFPVPADD76 pKa = 3.48LAKK79 pKa = 10.62CAMKK83 pKa = 10.35AVRR86 pKa = 11.84AVASGPGFSQRR97 pKa = 11.84MTYY100 pKa = 9.86PGNTCGIGYY109 pKa = 9.63EE110 pKa = 4.07LDD112 pKa = 3.32IGTGSAQFPEE122 pKa = 4.43ASTCAKK128 pKa = 10.34RR129 pKa = 11.84PAQSGWINPTAPTPSDD145 pKa = 3.5VCNDD149 pKa = 2.93GCYY152 pKa = 8.77YY153 pKa = 10.09TYY155 pKa = 11.0SVDD158 pKa = 3.29PGNPKK163 pKa = 10.27GYY165 pKa = 10.33SYY167 pKa = 10.46TPSGATCTTDD177 pKa = 4.31DD178 pKa = 4.42AAPPIDD184 pKa = 4.94DD185 pKa = 5.12GGDD188 pKa = 3.49GSDD191 pKa = 4.1GDD193 pKa = 4.09GGGDD197 pKa = 3.3GGGDD201 pKa = 3.3GGGDD205 pKa = 3.3GGGDD209 pKa = 3.3GGGDD213 pKa = 3.3GGGDD217 pKa = 3.3GGGDD221 pKa = 3.3GGGDD225 pKa = 3.3GGGDD229 pKa = 3.25GGGDD233 pKa = 3.52GDD235 pKa = 5.14GDD237 pKa = 4.05GDD239 pKa = 4.77GDD241 pKa = 4.51GDD243 pKa = 4.1TPGDD247 pKa = 3.86GDD249 pKa = 3.9GTTPGDD255 pKa = 3.76GEE257 pKa = 4.46GGEE260 pKa = 4.26GAPMSEE266 pKa = 4.89LYY268 pKa = 10.33KK269 pKa = 10.79KK270 pKa = 10.4SGKK273 pKa = 7.4TVEE276 pKa = 4.37SVLSKK281 pKa = 11.02FNTQVRR287 pKa = 11.84ATPMVGGITDD297 pKa = 4.47FMTVPSGGSCPVFSLGASKK316 pKa = 8.92WWNAMTINFHH326 pKa = 6.93CGGDD330 pKa = 3.5FLAFLRR336 pKa = 11.84AAGWVILAIAAYY348 pKa = 8.93AALRR352 pKa = 11.84IAVTT356 pKa = 3.72
MM1 pKa = 7.78WIHH4 pKa = 5.63GRR6 pKa = 11.84AVRR9 pKa = 11.84LGRR12 pKa = 11.84RR13 pKa = 11.84QGVGCVRR20 pKa = 11.84YY21 pKa = 9.07IVVVALCLAALFFSSRR37 pKa = 11.84VSAACVQLEE46 pKa = 4.32APTSSHH52 pKa = 6.46NGDD55 pKa = 3.59WSCADD60 pKa = 3.25QGEE63 pKa = 4.4AFAKK67 pKa = 10.28VSSFPVPADD76 pKa = 3.48LAKK79 pKa = 10.62CAMKK83 pKa = 10.35AVRR86 pKa = 11.84AVASGPGFSQRR97 pKa = 11.84MTYY100 pKa = 9.86PGNTCGIGYY109 pKa = 9.63EE110 pKa = 4.07LDD112 pKa = 3.32IGTGSAQFPEE122 pKa = 4.43ASTCAKK128 pKa = 10.34RR129 pKa = 11.84PAQSGWINPTAPTPSDD145 pKa = 3.5VCNDD149 pKa = 2.93GCYY152 pKa = 8.77YY153 pKa = 10.09TYY155 pKa = 11.0SVDD158 pKa = 3.29PGNPKK163 pKa = 10.27GYY165 pKa = 10.33SYY167 pKa = 10.46TPSGATCTTDD177 pKa = 4.31DD178 pKa = 4.42AAPPIDD184 pKa = 4.94DD185 pKa = 5.12GGDD188 pKa = 3.49GSDD191 pKa = 4.1GDD193 pKa = 4.09GGGDD197 pKa = 3.3GGGDD201 pKa = 3.3GGGDD205 pKa = 3.3GGGDD209 pKa = 3.3GGGDD213 pKa = 3.3GGGDD217 pKa = 3.3GGGDD221 pKa = 3.3GGGDD225 pKa = 3.3GGGDD229 pKa = 3.25GGGDD233 pKa = 3.52GDD235 pKa = 5.14GDD237 pKa = 4.05GDD239 pKa = 4.77GDD241 pKa = 4.51GDD243 pKa = 4.1TPGDD247 pKa = 3.86GDD249 pKa = 3.9GTTPGDD255 pKa = 3.76GEE257 pKa = 4.46GGEE260 pKa = 4.26GAPMSEE266 pKa = 4.89LYY268 pKa = 10.33KK269 pKa = 10.79KK270 pKa = 10.4SGKK273 pKa = 7.4TVEE276 pKa = 4.37SVLSKK281 pKa = 11.02FNTQVRR287 pKa = 11.84ATPMVGGITDD297 pKa = 4.47FMTVPSGGSCPVFSLGASKK316 pKa = 8.92WWNAMTINFHH326 pKa = 6.93CGGDD330 pKa = 3.5FLAFLRR336 pKa = 11.84AAGWVILAIAAYY348 pKa = 8.93AALRR352 pKa = 11.84IAVTT356 pKa = 3.72
Molecular weight: 35.4 kDa
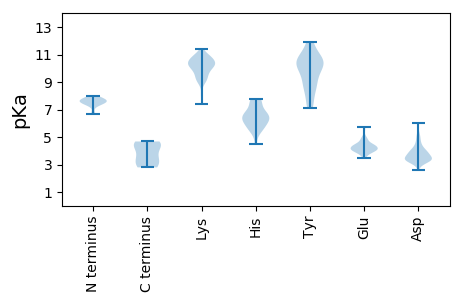
Isoelectric point according different methods:
Protein with the highest isoelectric point:
>tr|A0A2Z4QH79|A0A2Z4QH79_9VIRU Minor coat protein OS=Xanthomonas phage phiLf2 OX=2201344 GN=phiLf2_ORF7 PE=4 SV=1
MM1 pKa = 7.58ARR3 pKa = 11.84WCPPANRR10 pKa = 11.84LASAAATCSSVVANTACMRR29 pKa = 11.84WCKK32 pKa = 10.27KK33 pKa = 10.12RR34 pKa = 11.84SQCPARR40 pKa = 11.84RR41 pKa = 11.84TPP43 pKa = 3.36
MM1 pKa = 7.58ARR3 pKa = 11.84WCPPANRR10 pKa = 11.84LASAAATCSSVVANTACMRR29 pKa = 11.84WCKK32 pKa = 10.27KK33 pKa = 10.12RR34 pKa = 11.84SQCPARR40 pKa = 11.84RR41 pKa = 11.84TPP43 pKa = 3.36
Molecular weight: 4.71 kDa
Isoelectric point according different methods:
Peptides (in silico digests for buttom-up proteomics)
Below you can find in silico digests of the whole proteome with Trypsin, Chymotrypsin, Trypsin+LysC, LysN, ArgC proteases suitable for different mass spec machines.| Try ESI |
 |
|---|
| ChTry ESI |
 |
|---|
| ArgC ESI |
 |
|---|
| LysN ESI |
 |
|---|
| TryLysC ESI |
 |
|---|
| Try MALDI |
 |
|---|
| ChTry MALDI |
 |
|---|
| ArgC MALDI |
 |
|---|
| LysN MALDI |
 |
|---|
| TryLysC MALDI |
 |
|---|
| Try LTQ |
 |
|---|
| ChTry LTQ |
 |
|---|
| ArgC LTQ |
 |
|---|
| LysN LTQ |
 |
|---|
| TryLysC LTQ |
 |
|---|
| Try MSlow |
 |
|---|
| ChTry MSlow |
 |
|---|
| ArgC MSlow |
 |
|---|
| LysN MSlow |
 |
|---|
| TryLysC MSlow |
 |
|---|
| Try MShigh |
 |
|---|
| ChTry MShigh |
 |
|---|
| ArgC MShigh |
 |
|---|
| LysN MShigh |
 |
|---|
| TryLysC MShigh |
 |
|---|
General Statistics
Number of major isoforms |
Number of additional isoforms |
Number of all proteins |
Number of amino acids |
Min. Seq. Length |
Max. Seq. Length |
Avg. Seq. Length |
Avg. Mol. Weight |
|---|---|---|---|---|---|---|---|
0 |
1989 |
38 |
440 |
180.8 |
19.47 |
Amino acid frequency
Ala |
Cys |
Asp |
Glu |
Phe |
Gly |
His |
Ile |
Lys |
Leu |
|---|---|---|---|---|---|---|---|---|---|
12.167 ± 0.804 | 1.961 ± 0.512 |
6.285 ± 0.799 | 3.922 ± 0.442 |
3.318 ± 0.316 | 11.111 ± 1.66 |
1.508 ± 0.299 | 3.922 ± 0.319 |
4.827 ± 0.565 | 7.541 ± 0.76 |
Met |
Asn |
Gln |
Pro |
Arg |
Ser |
Thr |
Val |
Trp |
Tyr |
|---|---|---|---|---|---|---|---|---|---|
2.665 ± 0.462 | 2.363 ± 0.303 |
5.078 ± 0.479 | 3.067 ± 0.4 |
6.687 ± 0.836 | 5.681 ± 0.442 |
5.38 ± 0.255 | 7.34 ± 0.604 |
2.413 ± 0.309 | 2.765 ± 0.352 |
Most of the basic statistics you can see at this page can be downloaded from this CSV file
Proteome-pI is available under Creative Commons Attribution-NoDerivs license, for more details see here
| Reference: Kozlowski LP. Proteome-pI 2.0: Proteome Isoelectric Point Database Update. Nucleic Acids Res. 2021, doi: 10.1093/nar/gkab944 | Contact: Lukasz P. Kozlowski |
