Oryza brachyantha
Taxonomy: cellular organisms; Eukaryota; Viridiplantae; Streptophyta; Streptophytina; Embryophyta; Tracheophyta; Euphyllophyta; Spermatophyta; Magnoliopsida; Mesangiospermae; Liliopsida; Petrosaviidae; commelinids; Poales; Poaceae; BOP clade; Oryzoideae; Oryzeae; Oryzinae; Oryza
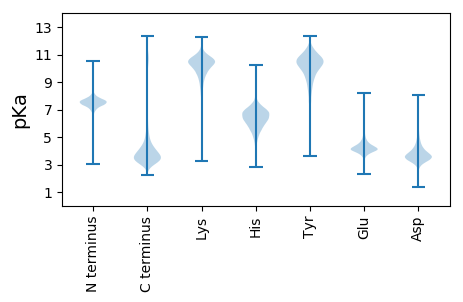
Average proteome isoelectric point is 6.97
Get precalculated fractions of proteins

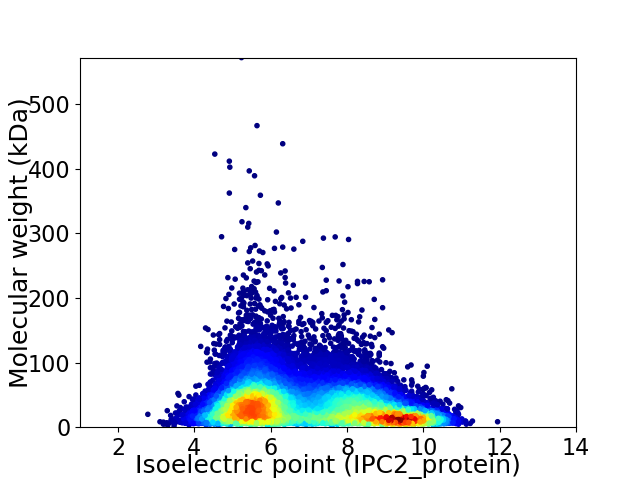
Virtual 2D-PAGE plot for 31989 proteins (isoelectric point calculated using IPC2_protein)
Get csv file with sequences according to given criteria:
* You can choose from 21 different methods for calculating isoelectric point
Summary statistics related to proteome-wise predictions


Protein with the lowest isoelectric point:
>tr|J3L809|J3L809_ORYBR Apple domain-containing protein OS=Oryza brachyantha OX=4533 PE=4 SV=1
HHH2 pKa = 7.85FPGPVRR8 pKa = 11.84PDDD11 pKa = 3.19VLEEE15 pKa = 4.15MVGNPANPGQAMPDDD30 pKa = 3.34PAAADDD36 pKa = 3.78STIDDD41 pKa = 5.34AMLYYY46 pKa = 10.66KKK48 pKa = 10.06LNHHH52 pKa = 7.28PTDDD56 pKa = 3.61VVGGAVTPEEE66 pKa = 4.27AGHHH70 pKa = 6.08DDD72 pKa = 3.84DD73 pKa = 6.45FDDD76 pKa = 3.72FSASSDDD83 pKa = 3.52SPGILAPAQFDDD95 pKa = 3.67SQDDD99 pKa = 3.42FGEEE103 pKa = 4.24SSPASGNDDD112 pKa = 3.23TSATTATTTMLCTDDD127 pKa = 4.41SVQAALGEEE136 pKa = 4.69NFAMDDD142 pKa = 3.58SCFDDD147 pKa = 3.94LGLPTDDD154 pKa = 3.53GGGGSPSSGGSIVPSLSTWEEE175 pKa = 4.01EE176 pKa = 3.7KKK178 pKa = 10.66YY179 pKa = 10.88DD180 pKa = 4.06LDDD183 pKa = 3.76FPDDD187 pKa = 3.51DD188 pKa = 4.48MSLHHH193 pKa = 6.95EE194 pKa = 4.8MISAPDDD201 pKa = 3.84HH202 pKa = 6.73DD203 pKa = 4.46SVDDD207 pKa = 3.78QGLEEE212 pKa = 4.09LYYY215 pKa = 9.83P
HHH2 pKa = 7.85FPGPVRR8 pKa = 11.84PDDD11 pKa = 3.19VLEEE15 pKa = 4.15MVGNPANPGQAMPDDD30 pKa = 3.34PAAADDD36 pKa = 3.78STIDDD41 pKa = 5.34AMLYYY46 pKa = 10.66KKK48 pKa = 10.06LNHHH52 pKa = 7.28PTDDD56 pKa = 3.61VVGGAVTPEEE66 pKa = 4.27AGHHH70 pKa = 6.08DDD72 pKa = 3.84DD73 pKa = 6.45FDDD76 pKa = 3.72FSASSDDD83 pKa = 3.52SPGILAPAQFDDD95 pKa = 3.67SQDDD99 pKa = 3.42FGEEE103 pKa = 4.24SSPASGNDDD112 pKa = 3.23TSATTATTTMLCTDDD127 pKa = 4.41SVQAALGEEE136 pKa = 4.69NFAMDDD142 pKa = 3.58SCFDDD147 pKa = 3.94LGLPTDDD154 pKa = 3.53GGGGSPSSGGSIVPSLSTWEEE175 pKa = 4.01EE176 pKa = 3.7KKK178 pKa = 10.66YY179 pKa = 10.88DD180 pKa = 4.06LDDD183 pKa = 3.76FPDDD187 pKa = 3.51DD188 pKa = 4.48MSLHHH193 pKa = 6.95EE194 pKa = 4.8MISAPDDD201 pKa = 3.84HH202 pKa = 6.73DD203 pKa = 4.46SVDDD207 pKa = 3.78QGLEEE212 pKa = 4.09LYYY215 pKa = 9.83P
Molecular weight: 22.2 kDa
Isoelectric point according different methods:
Protein with the highest isoelectric point:
>tr|J3NBH6|J3NBH6_ORYBR Uncharacterized protein OS=Oryza brachyantha OX=4533 PE=4 SV=1
MM1 pKa = 7.61GGPMLSAASRR11 pKa = 11.84PAMSPPADD19 pKa = 4.32APPSLATRR27 pKa = 11.84SPASLSARR35 pKa = 11.84PSSAAGPVRR44 pKa = 11.84WRR46 pKa = 11.84RR47 pKa = 11.84RR48 pKa = 11.84RR49 pKa = 11.84RR50 pKa = 11.84RR51 pKa = 11.84RR52 pKa = 11.84QPRR55 pKa = 11.84RR56 pKa = 11.84GSGARR61 pKa = 11.84TRR63 pKa = 11.84RR64 pKa = 11.84RR65 pKa = 11.84TPAPPSRR72 pKa = 11.84ASRR75 pKa = 11.84RR76 pKa = 11.84PSSRR80 pKa = 11.84RR81 pKa = 11.84RR82 pKa = 11.84RR83 pKa = 11.84RR84 pKa = 11.84GGSS87 pKa = 2.96
MM1 pKa = 7.61GGPMLSAASRR11 pKa = 11.84PAMSPPADD19 pKa = 4.32APPSLATRR27 pKa = 11.84SPASLSARR35 pKa = 11.84PSSAAGPVRR44 pKa = 11.84WRR46 pKa = 11.84RR47 pKa = 11.84RR48 pKa = 11.84RR49 pKa = 11.84RR50 pKa = 11.84RR51 pKa = 11.84RR52 pKa = 11.84QPRR55 pKa = 11.84RR56 pKa = 11.84GSGARR61 pKa = 11.84TRR63 pKa = 11.84RR64 pKa = 11.84RR65 pKa = 11.84TPAPPSRR72 pKa = 11.84ASRR75 pKa = 11.84RR76 pKa = 11.84PSSRR80 pKa = 11.84RR81 pKa = 11.84RR82 pKa = 11.84RR83 pKa = 11.84RR84 pKa = 11.84GGSS87 pKa = 2.96
Molecular weight: 9.48 kDa
Isoelectric point according different methods:
Peptides (in silico digests for buttom-up proteomics)
Below you can find in silico digests of the whole proteome with Trypsin, Chymotrypsin, Trypsin+LysC, LysN, ArgC proteases suitable for different mass spec machines.| Try ESI |
 |
|---|
| ChTry ESI |
 |
|---|
| ArgC ESI |
 |
|---|
| LysN ESI |
 |
|---|
| TryLysC ESI |
 |
|---|
| Try MALDI |
 |
|---|
| ChTry MALDI |
 |
|---|
| ArgC MALDI |
 |
|---|
| LysN MALDI |
 |
|---|
| TryLysC MALDI |
 |
|---|
| Try LTQ |
 |
|---|
| ChTry LTQ |
 |
|---|
| ArgC LTQ |
 |
|---|
| LysN LTQ |
 |
|---|
| TryLysC LTQ |
 |
|---|
| Try MSlow |
 |
|---|
| ChTry MSlow |
 |
|---|
| ArgC MSlow |
 |
|---|
| LysN MSlow |
 |
|---|
| TryLysC MSlow |
 |
|---|
| Try MShigh |
 |
|---|
| ChTry MShigh |
 |
|---|
| ArgC MShigh |
 |
|---|
| LysN MShigh |
 |
|---|
| TryLysC MShigh |
 |
|---|
General Statistics
Number of major isoforms |
Number of additional isoforms |
Number of all proteins |
Number of amino acids |
Min. Seq. Length |
Max. Seq. Length |
Avg. Seq. Length |
Avg. Mol. Weight |
|---|---|---|---|---|---|---|---|
0 |
11295499 |
28 |
5111 |
353.1 |
38.27 |
Amino acid frequency
Ala |
Cys |
Asp |
Glu |
Phe |
Gly |
His |
Ile |
Lys |
Leu |
|---|---|---|---|---|---|---|---|---|---|
8.617 ± 0.02 | 1.909 ± 0.006 |
5.286 ± 0.012 | 5.936 ± 0.016 |
3.664 ± 0.008 | 7.2 ± 0.018 |
2.47 ± 0.007 | 4.452 ± 0.012 |
4.949 ± 0.015 | 9.38 ± 0.019 |
Met |
Asn |
Gln |
Pro |
Arg |
Ser |
Thr |
Val |
Trp |
Tyr |
|---|---|---|---|---|---|---|---|---|---|
2.451 ± 0.007 | 3.545 ± 0.01 |
5.297 ± 0.016 | 3.44 ± 0.011 |
6.188 ± 0.015 | 8.173 ± 0.02 |
4.739 ± 0.008 | 6.688 ± 0.011 |
1.281 ± 0.005 | 2.58 ± 0.008 |
Most of the basic statistics you can see at this page can be downloaded from this CSV file
Proteome-pI is available under Creative Commons Attribution-NoDerivs license, for more details see here
| Reference: Kozlowski LP. Proteome-pI 2.0: Proteome Isoelectric Point Database Update. Nucleic Acids Res. 2021, doi: 10.1093/nar/gkab944 | Contact: Lukasz P. Kozlowski |
