Gaeumannomyces tritici (strain R3-111a-1) (Wheat and barley take-all root rot fungus) (Gaeumannomyces graminis var. tritici)
Taxonomy: cellular organisms; Eukaryota; Opisthokonta; Fungi; Dikarya; Ascomycota; saccharomyceta; Pezizomycotina; leotiomyceta; sordariomyceta; Sordariomycetes; Sordariomycetidae; Magnaporthales; Magnaporthaceae; Gaeumannomyces; Gaeumannomyces tritici
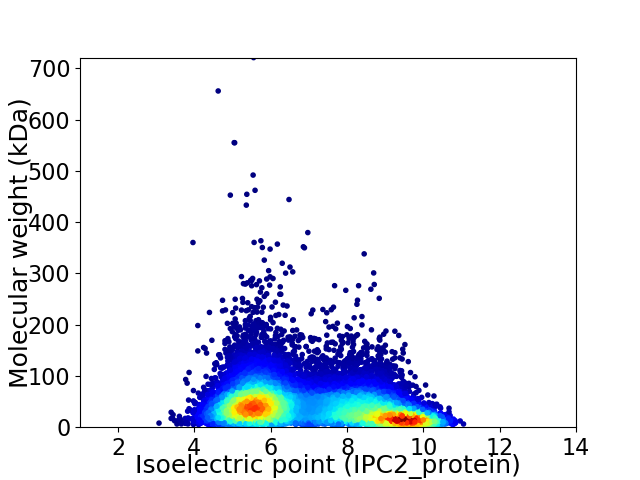
Average proteome isoelectric point is 7.04
Get precalculated fractions of proteins

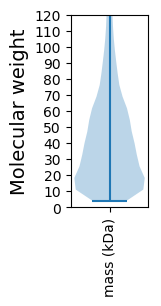
Virtual 2D-PAGE plot for 14597 proteins (isoelectric point calculated using IPC2_protein)
Get csv file with sequences according to given criteria:
* You can choose from 21 different methods for calculating isoelectric point
Summary statistics related to proteome-wise predictions


Protein with the lowest isoelectric point:
>tr|J3NV87|J3NV87_GAET3 Metacaspase-1 OS=Gaeumannomyces tritici (strain R3-111a-1) OX=644352 GN=20345658 PE=3 SV=1
MM1 pKa = 7.07NRR3 pKa = 11.84AGGSRR8 pKa = 11.84RR9 pKa = 11.84ACVAGDD15 pKa = 3.8FEE17 pKa = 4.65QCLHH21 pKa = 5.85VVFEE25 pKa = 4.57RR26 pKa = 11.84PRR28 pKa = 11.84PCLFRR33 pKa = 11.84GSEE36 pKa = 4.35LMCQPTVVEE45 pKa = 5.4DD46 pKa = 3.97LLDD49 pKa = 3.41VCGRR53 pKa = 11.84CRR55 pKa = 11.84TWPGSYY61 pKa = 9.72EE62 pKa = 4.12LWRR65 pKa = 11.84APPLPPGWDD74 pKa = 3.4EE75 pKa = 4.62DD76 pKa = 4.52LSDD79 pKa = 3.72GTVPDD84 pKa = 3.94GDD86 pKa = 4.44YY87 pKa = 10.83EE88 pKa = 4.45DD89 pKa = 4.72SSSEE93 pKa = 3.95EE94 pKa = 4.36SPCSSVLSTVFSLSDD109 pKa = 3.3EE110 pKa = 4.53CSTGDD115 pKa = 3.37TDD117 pKa = 3.82SCSDD121 pKa = 3.69YY122 pKa = 11.41EE123 pKa = 4.6EE124 pKa = 4.82EE125 pKa = 6.32DD126 pKa = 3.61GDD128 pKa = 3.9GWKK131 pKa = 10.97GGDD134 pKa = 3.45DD135 pKa = 3.66AGEE138 pKa = 4.45GEE140 pKa = 4.49YY141 pKa = 10.99SLTRR145 pKa = 11.84RR146 pKa = 11.84DD147 pKa = 3.33TCLLPGG153 pKa = 3.93
MM1 pKa = 7.07NRR3 pKa = 11.84AGGSRR8 pKa = 11.84RR9 pKa = 11.84ACVAGDD15 pKa = 3.8FEE17 pKa = 4.65QCLHH21 pKa = 5.85VVFEE25 pKa = 4.57RR26 pKa = 11.84PRR28 pKa = 11.84PCLFRR33 pKa = 11.84GSEE36 pKa = 4.35LMCQPTVVEE45 pKa = 5.4DD46 pKa = 3.97LLDD49 pKa = 3.41VCGRR53 pKa = 11.84CRR55 pKa = 11.84TWPGSYY61 pKa = 9.72EE62 pKa = 4.12LWRR65 pKa = 11.84APPLPPGWDD74 pKa = 3.4EE75 pKa = 4.62DD76 pKa = 4.52LSDD79 pKa = 3.72GTVPDD84 pKa = 3.94GDD86 pKa = 4.44YY87 pKa = 10.83EE88 pKa = 4.45DD89 pKa = 4.72SSSEE93 pKa = 3.95EE94 pKa = 4.36SPCSSVLSTVFSLSDD109 pKa = 3.3EE110 pKa = 4.53CSTGDD115 pKa = 3.37TDD117 pKa = 3.82SCSDD121 pKa = 3.69YY122 pKa = 11.41EE123 pKa = 4.6EE124 pKa = 4.82EE125 pKa = 6.32DD126 pKa = 3.61GDD128 pKa = 3.9GWKK131 pKa = 10.97GGDD134 pKa = 3.45DD135 pKa = 3.66AGEE138 pKa = 4.45GEE140 pKa = 4.49YY141 pKa = 10.99SLTRR145 pKa = 11.84RR146 pKa = 11.84DD147 pKa = 3.33TCLLPGG153 pKa = 3.93
Molecular weight: 16.71 kDa
Isoelectric point according different methods:
Protein with the highest isoelectric point:
>tr|J3PCI5|J3PCI5_GAET3 ATP-dependent DNA helicase OS=Gaeumannomyces tritici (strain R3-111a-1) OX=644352 GN=20351664 PE=3 SV=1
MM1 pKa = 7.48PVFRR5 pKa = 11.84RR6 pKa = 11.84ARR8 pKa = 11.84GRR10 pKa = 11.84KK11 pKa = 8.34VMVRR15 pKa = 11.84ILLAKK20 pKa = 8.47TRR22 pKa = 11.84KK23 pKa = 10.27AMDD26 pKa = 3.28QGSASHH32 pKa = 6.72RR33 pKa = 11.84GHH35 pKa = 6.45RR36 pKa = 11.84HH37 pKa = 4.49GLVSQRR43 pKa = 11.84QLKK46 pKa = 7.63STRR49 pKa = 11.84GPARR53 pKa = 11.84EE54 pKa = 3.88VWSRR58 pKa = 11.84WGSRR62 pKa = 11.84QGRR65 pKa = 11.84SSNVMLRR72 pKa = 11.84GPFSGG77 pKa = 4.16
MM1 pKa = 7.48PVFRR5 pKa = 11.84RR6 pKa = 11.84ARR8 pKa = 11.84GRR10 pKa = 11.84KK11 pKa = 8.34VMVRR15 pKa = 11.84ILLAKK20 pKa = 8.47TRR22 pKa = 11.84KK23 pKa = 10.27AMDD26 pKa = 3.28QGSASHH32 pKa = 6.72RR33 pKa = 11.84GHH35 pKa = 6.45RR36 pKa = 11.84HH37 pKa = 4.49GLVSQRR43 pKa = 11.84QLKK46 pKa = 7.63STRR49 pKa = 11.84GPARR53 pKa = 11.84EE54 pKa = 3.88VWSRR58 pKa = 11.84WGSRR62 pKa = 11.84QGRR65 pKa = 11.84SSNVMLRR72 pKa = 11.84GPFSGG77 pKa = 4.16
Molecular weight: 8.77 kDa
Isoelectric point according different methods:
Peptides (in silico digests for buttom-up proteomics)
Below you can find in silico digests of the whole proteome with Trypsin, Chymotrypsin, Trypsin+LysC, LysN, ArgC proteases suitable for different mass spec machines.| Try ESI |
 |
|---|
| ChTry ESI |
 |
|---|
| ArgC ESI |
 |
|---|
| LysN ESI |
 |
|---|
| TryLysC ESI |
 |
|---|
| Try MALDI |
 |
|---|
| ChTry MALDI |
 |
|---|
| ArgC MALDI |
 |
|---|
| LysN MALDI |
 |
|---|
| TryLysC MALDI |
 |
|---|
| Try LTQ |
 |
|---|
| ChTry LTQ |
 |
|---|
| ArgC LTQ |
 |
|---|
| LysN LTQ |
 |
|---|
| TryLysC LTQ |
 |
|---|
| Try MSlow |
 |
|---|
| ChTry MSlow |
 |
|---|
| ArgC MSlow |
 |
|---|
| LysN MSlow |
 |
|---|
| TryLysC MSlow |
 |
|---|
| Try MShigh |
 |
|---|
| ChTry MShigh |
 |
|---|
| ArgC MShigh |
 |
|---|
| LysN MShigh |
 |
|---|
| TryLysC MShigh |
 |
|---|
General Statistics
Number of major isoforms |
Number of additional isoforms |
Number of all proteins |
Number of amino acids |
Min. Seq. Length |
Max. Seq. Length |
Avg. Seq. Length |
Avg. Mol. Weight |
|---|---|---|---|---|---|---|---|
6286680 |
32 |
6633 |
430.7 |
46.99 |
Amino acid frequency
Ala |
Cys |
Asp |
Glu |
Phe |
Gly |
His |
Ile |
Lys |
Leu |
|---|---|---|---|---|---|---|---|---|---|
10.47 ± 0.024 | 1.314 ± 0.009 |
5.69 ± 0.015 | 5.63 ± 0.021 |
3.361 ± 0.014 | 7.987 ± 0.023 |
2.383 ± 0.01 | 3.891 ± 0.013 |
4.222 ± 0.019 | 8.64 ± 0.027 |
Met |
Asn |
Gln |
Pro |
Arg |
Ser |
Thr |
Val |
Trp |
Tyr |
|---|---|---|---|---|---|---|---|---|---|
2.14 ± 0.008 | 3.078 ± 0.013 |
6.741 ± 0.028 | 3.914 ± 0.021 |
6.988 ± 0.018 | 7.905 ± 0.024 |
5.563 ± 0.016 | 6.272 ± 0.018 |
1.461 ± 0.009 | 2.349 ± 0.01 |
Most of the basic statistics you can see at this page can be downloaded from this CSV file
Proteome-pI is available under Creative Commons Attribution-NoDerivs license, for more details see here
| Reference: Kozlowski LP. Proteome-pI 2.0: Proteome Isoelectric Point Database Update. Nucleic Acids Res. 2021, doi: 10.1093/nar/gkab944 | Contact: Lukasz P. Kozlowski |
