Sanguibacter gelidistatuariae
Taxonomy: cellular organisms; Bacteria; Terrabacteria group; Actinobacteria; Actinomycetia; Micrococcales; Sanguibacteraceae; Sanguibacter
Average proteome isoelectric point is 5.96
Get precalculated fractions of proteins

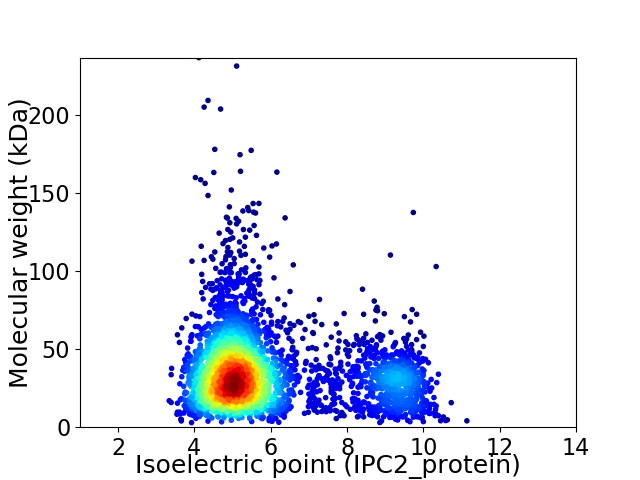
Virtual 2D-PAGE plot for 3525 proteins (isoelectric point calculated using IPC2_protein)
Get csv file with sequences according to given criteria:
* You can choose from 21 different methods for calculating isoelectric point
Summary statistics related to proteome-wise predictions


Protein with the lowest isoelectric point:
>tr|A0A1G6QEP6|A0A1G6QEP6_9MICO NADH dehydrogenase OS=Sanguibacter gelidistatuariae OX=1814289 GN=SAMN05216410_2524 PE=4 SV=1
MM1 pKa = 7.07NRR3 pKa = 11.84SSVRR7 pKa = 11.84AWAAAASAVLVTGIGLGGCSFVTGTTDD34 pKa = 2.55IVQLVGVAMPTTTSLRR50 pKa = 11.84WIEE53 pKa = 4.57DD54 pKa = 3.42GNNVKK59 pKa = 10.5AQLEE63 pKa = 4.22DD64 pKa = 2.93LGYY67 pKa = 10.89AVEE70 pKa = 5.09LVYY73 pKa = 11.14AEE75 pKa = 4.44NDD77 pKa = 3.25VPTQVAQVEE86 pKa = 4.34AMISHH91 pKa = 6.81GADD94 pKa = 3.18LLIIGSVDD102 pKa = 2.95GTALKK107 pKa = 10.65DD108 pKa = 3.7QLASAAAAGIPIISYY123 pKa = 10.58DD124 pKa = 3.42RR125 pKa = 11.84LIRR128 pKa = 11.84DD129 pKa = 3.86SPDD132 pKa = 2.49VDD134 pKa = 4.09YY135 pKa = 11.58YY136 pKa = 11.54ATFDD140 pKa = 3.62NLRR143 pKa = 11.84VGTQQATSLLQGLGVLDD160 pKa = 4.15AAGEE164 pKa = 4.24PTGAAGPFAIEE175 pKa = 4.22VFAGSPDD182 pKa = 3.96DD183 pKa = 4.44NNATVFYY190 pKa = 9.36EE191 pKa = 4.32GAFAVLQPYY200 pKa = 9.48IDD202 pKa = 3.98SGVLVIPSGEE212 pKa = 4.06TDD214 pKa = 3.71FQTIAIQAWDD224 pKa = 3.69PVLGGEE230 pKa = 5.33RR231 pKa = 11.84MDD233 pKa = 4.57ALLSTTYY240 pKa = 10.08TSSTEE245 pKa = 4.16VIDD248 pKa = 5.96GILSPYY254 pKa = 10.39DD255 pKa = 3.96GISRR259 pKa = 11.84AVIEE263 pKa = 4.27SLKK266 pKa = 8.58TAGYY270 pKa = 7.85GTGDD274 pKa = 3.33RR275 pKa = 11.84PLPVVSGQDD284 pKa = 3.11AEE286 pKa = 4.5LPSVQSIIAGEE297 pKa = 4.17QYY299 pKa = 9.62STIYY303 pKa = 10.71KK304 pKa = 8.42DD305 pKa = 3.38TRR307 pKa = 11.84QLAEE311 pKa = 3.92VTVAMGDD318 pKa = 3.57ALLKK322 pKa = 10.35GAEE325 pKa = 4.49PEE327 pKa = 4.44TNDD330 pKa = 2.72ITSYY334 pKa = 11.74DD335 pKa = 3.88NGTGIVPTYY344 pKa = 10.9LLGPLVVTQATYY356 pKa = 11.11QSILVGGGYY365 pKa = 7.89YY366 pKa = 9.74TEE368 pKa = 5.39DD369 pKa = 3.61EE370 pKa = 4.38LRR372 pKa = 4.97
MM1 pKa = 7.07NRR3 pKa = 11.84SSVRR7 pKa = 11.84AWAAAASAVLVTGIGLGGCSFVTGTTDD34 pKa = 2.55IVQLVGVAMPTTTSLRR50 pKa = 11.84WIEE53 pKa = 4.57DD54 pKa = 3.42GNNVKK59 pKa = 10.5AQLEE63 pKa = 4.22DD64 pKa = 2.93LGYY67 pKa = 10.89AVEE70 pKa = 5.09LVYY73 pKa = 11.14AEE75 pKa = 4.44NDD77 pKa = 3.25VPTQVAQVEE86 pKa = 4.34AMISHH91 pKa = 6.81GADD94 pKa = 3.18LLIIGSVDD102 pKa = 2.95GTALKK107 pKa = 10.65DD108 pKa = 3.7QLASAAAAGIPIISYY123 pKa = 10.58DD124 pKa = 3.42RR125 pKa = 11.84LIRR128 pKa = 11.84DD129 pKa = 3.86SPDD132 pKa = 2.49VDD134 pKa = 4.09YY135 pKa = 11.58YY136 pKa = 11.54ATFDD140 pKa = 3.62NLRR143 pKa = 11.84VGTQQATSLLQGLGVLDD160 pKa = 4.15AAGEE164 pKa = 4.24PTGAAGPFAIEE175 pKa = 4.22VFAGSPDD182 pKa = 3.96DD183 pKa = 4.44NNATVFYY190 pKa = 9.36EE191 pKa = 4.32GAFAVLQPYY200 pKa = 9.48IDD202 pKa = 3.98SGVLVIPSGEE212 pKa = 4.06TDD214 pKa = 3.71FQTIAIQAWDD224 pKa = 3.69PVLGGEE230 pKa = 5.33RR231 pKa = 11.84MDD233 pKa = 4.57ALLSTTYY240 pKa = 10.08TSSTEE245 pKa = 4.16VIDD248 pKa = 5.96GILSPYY254 pKa = 10.39DD255 pKa = 3.96GISRR259 pKa = 11.84AVIEE263 pKa = 4.27SLKK266 pKa = 8.58TAGYY270 pKa = 7.85GTGDD274 pKa = 3.33RR275 pKa = 11.84PLPVVSGQDD284 pKa = 3.11AEE286 pKa = 4.5LPSVQSIIAGEE297 pKa = 4.17QYY299 pKa = 9.62STIYY303 pKa = 10.71KK304 pKa = 8.42DD305 pKa = 3.38TRR307 pKa = 11.84QLAEE311 pKa = 3.92VTVAMGDD318 pKa = 3.57ALLKK322 pKa = 10.35GAEE325 pKa = 4.49PEE327 pKa = 4.44TNDD330 pKa = 2.72ITSYY334 pKa = 11.74DD335 pKa = 3.88NGTGIVPTYY344 pKa = 10.9LLGPLVVTQATYY356 pKa = 11.11QSILVGGGYY365 pKa = 7.89YY366 pKa = 9.74TEE368 pKa = 5.39DD369 pKa = 3.61EE370 pKa = 4.38LRR372 pKa = 4.97
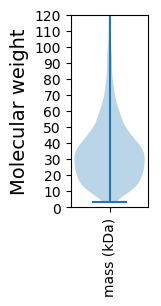
Molecular weight: 38.92 kDa
Isoelectric point according different methods:
Protein with the highest isoelectric point:
>tr|A0A1G6XGV6|A0A1G6XGV6_9MICO Evolved beta-galactosidase subunit beta OS=Sanguibacter gelidistatuariae OX=1814289 GN=SAMN05216410_0131 PE=4 SV=1
MM1 pKa = 7.4GSVIKK6 pKa = 10.42KK7 pKa = 8.47RR8 pKa = 11.84RR9 pKa = 11.84KK10 pKa = 9.22RR11 pKa = 11.84MAKK14 pKa = 9.41KK15 pKa = 9.87KK16 pKa = 9.7HH17 pKa = 5.84RR18 pKa = 11.84KK19 pKa = 8.56LLRR22 pKa = 11.84KK23 pKa = 7.78TRR25 pKa = 11.84HH26 pKa = 3.65QRR28 pKa = 11.84RR29 pKa = 11.84NKK31 pKa = 9.78KK32 pKa = 9.85
MM1 pKa = 7.4GSVIKK6 pKa = 10.42KK7 pKa = 8.47RR8 pKa = 11.84RR9 pKa = 11.84KK10 pKa = 9.22RR11 pKa = 11.84MAKK14 pKa = 9.41KK15 pKa = 9.87KK16 pKa = 9.7HH17 pKa = 5.84RR18 pKa = 11.84KK19 pKa = 8.56LLRR22 pKa = 11.84KK23 pKa = 7.78TRR25 pKa = 11.84HH26 pKa = 3.65QRR28 pKa = 11.84RR29 pKa = 11.84NKK31 pKa = 9.78KK32 pKa = 9.85
Molecular weight: 4.08 kDa
Isoelectric point according different methods:
Peptides (in silico digests for buttom-up proteomics)
Below you can find in silico digests of the whole proteome with Trypsin, Chymotrypsin, Trypsin+LysC, LysN, ArgC proteases suitable for different mass spec machines.| Try ESI |
 |
|---|
| ChTry ESI |
 |
|---|
| ArgC ESI |
 |
|---|
| LysN ESI |
 |
|---|
| TryLysC ESI |
 |
|---|
| Try MALDI |
 |
|---|
| ChTry MALDI |
 |
|---|
| ArgC MALDI |
 |
|---|
| LysN MALDI |
 |
|---|
| TryLysC MALDI |
 |
|---|
| Try LTQ |
 |
|---|
| ChTry LTQ |
 |
|---|
| ArgC LTQ |
 |
|---|
| LysN LTQ |
 |
|---|
| TryLysC LTQ |
 |
|---|
| Try MSlow |
 |
|---|
| ChTry MSlow |
 |
|---|
| ArgC MSlow |
 |
|---|
| LysN MSlow |
 |
|---|
| TryLysC MSlow |
 |
|---|
| Try MShigh |
 |
|---|
| ChTry MShigh |
 |
|---|
| ArgC MShigh |
 |
|---|
| LysN MShigh |
 |
|---|
| TryLysC MShigh |
 |
|---|
General Statistics
Number of major isoforms |
Number of additional isoforms |
Number of all proteins |
Number of amino acids |
Min. Seq. Length |
Max. Seq. Length |
Avg. Seq. Length |
Avg. Mol. Weight |
|---|---|---|---|---|---|---|---|
0 |
1210563 |
25 |
2253 |
343.4 |
36.47 |
Amino acid frequency
Ala |
Cys |
Asp |
Glu |
Phe |
Gly |
His |
Ile |
Lys |
Leu |
|---|---|---|---|---|---|---|---|---|---|
13.728 ± 0.06 | 0.583 ± 0.012 |
6.14 ± 0.033 | 5.169 ± 0.035 |
2.875 ± 0.023 | 9.024 ± 0.039 |
2.031 ± 0.021 | 4.13 ± 0.032 |
1.899 ± 0.026 | 10.159 ± 0.049 |
Met |
Asn |
Gln |
Pro |
Arg |
Ser |
Thr |
Val |
Trp |
Tyr |
|---|---|---|---|---|---|---|---|---|---|
1.844 ± 0.018 | 1.879 ± 0.021 |
5.588 ± 0.029 | 2.834 ± 0.021 |
6.823 ± 0.043 | 5.895 ± 0.03 |
6.684 ± 0.042 | 9.344 ± 0.038 |
1.473 ± 0.018 | 1.897 ± 0.022 |
Most of the basic statistics you can see at this page can be downloaded from this CSV file
Proteome-pI is available under Creative Commons Attribution-NoDerivs license, for more details see here
| Reference: Kozlowski LP. Proteome-pI 2.0: Proteome Isoelectric Point Database Update. Nucleic Acids Res. 2021, doi: 10.1093/nar/gkab944 | Contact: Lukasz P. Kozlowski |
