Saccharopolyspora coralli
Taxonomy: cellular organisms; Bacteria; Terrabacteria group; Actinobacteria; Actinomycetia; Pseudonocardiales; Pseudonocardiaceae; Saccharopolyspora
Average proteome isoelectric point is 5.99
Get precalculated fractions of proteins
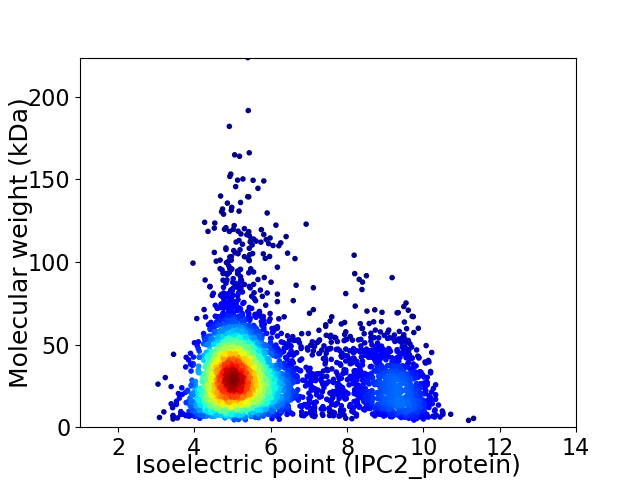
Virtual 2D-PAGE plot for 4296 proteins (isoelectric point calculated using IPC2_protein)
Get csv file with sequences according to given criteria:
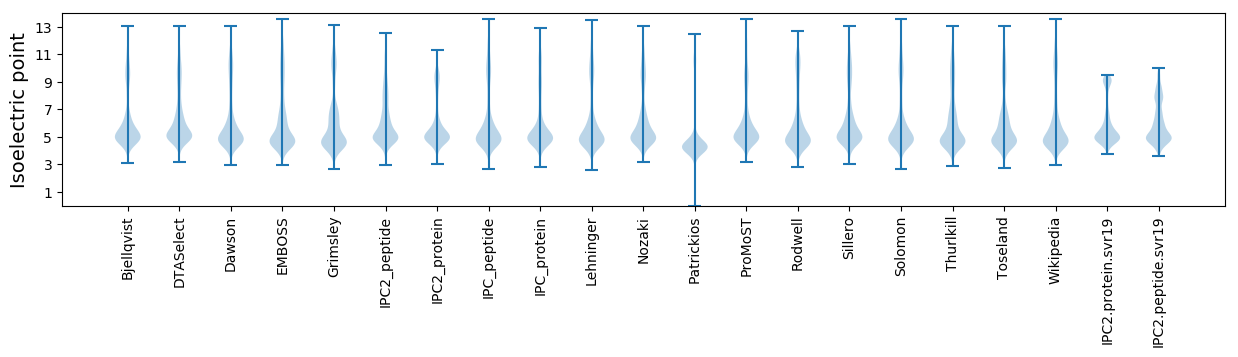
* You can choose from 21 different methods for calculating isoelectric point
Summary statistics related to proteome-wise predictions
Protein with the lowest isoelectric point:
>tr|A0A5Q3QGE1|A0A5Q3QGE1_9PSEU Helix-turn-helix domain-containing protein OS=Saccharopolyspora coralli OX=2665642 GN=GIY23_14755 PE=4 SV=1
MM1 pKa = 7.53RR2 pKa = 11.84TRR4 pKa = 11.84TLLAGAATVVVATGMAVPAAVVAAPSPDD32 pKa = 3.48YY33 pKa = 10.69SAPAAMTHH41 pKa = 5.22LQEE44 pKa = 4.69LDD46 pKa = 3.59RR47 pKa = 11.84IAAEE51 pKa = 4.05NGGNRR56 pKa = 11.84AVGTPGYY63 pKa = 9.44EE64 pKa = 3.59AALDD68 pKa = 3.97YY69 pKa = 10.95VQQQLDD75 pKa = 3.27QAGFVTTRR83 pKa = 11.84QEE85 pKa = 3.71FTYY88 pKa = 10.84GGTTTWNLLAEE99 pKa = 4.55TEE101 pKa = 4.53GGNADD106 pKa = 3.43NTVVVGAHH114 pKa = 6.52LDD116 pKa = 3.88GVEE119 pKa = 4.23SGHH122 pKa = 7.03GINDD126 pKa = 3.59NGSGSAAVLNSALQYY141 pKa = 10.6AEE143 pKa = 4.82SGAEE147 pKa = 3.84PANKK151 pKa = 9.73LRR153 pKa = 11.84FAFWGAEE160 pKa = 3.92EE161 pKa = 4.22VGLVGSTHH169 pKa = 6.03YY170 pKa = 11.31VDD172 pKa = 4.02TLSQQEE178 pKa = 3.82RR179 pKa = 11.84DD180 pKa = 3.76QIAMYY185 pKa = 10.65LNYY188 pKa = 11.24DD189 pKa = 3.5MVGSNNAGYY198 pKa = 7.86FTYY201 pKa = 10.71DD202 pKa = 3.2GDD204 pKa = 4.48DD205 pKa = 3.48SDD207 pKa = 5.57GVGAGPGPDD216 pKa = 3.12GSAEE220 pKa = 3.88IEE222 pKa = 4.16QALNDD227 pKa = 4.19ALSGAGVEE235 pKa = 4.3PDD237 pKa = 3.12GTDD240 pKa = 3.37FDD242 pKa = 4.22GRR244 pKa = 11.84SDD246 pKa = 3.81YY247 pKa = 11.58GPFIEE252 pKa = 5.33VGIPSGGIFTGAEE265 pKa = 3.33GRR267 pKa = 11.84MTQEE271 pKa = 5.17QAQKK275 pKa = 8.44WNGRR279 pKa = 11.84AGEE282 pKa = 4.51PYY284 pKa = 10.08DD285 pKa = 3.68ACYY288 pKa = 10.04HH289 pKa = 5.06QACDD293 pKa = 5.9DD294 pKa = 4.2LDD296 pKa = 3.94NLNNEE301 pKa = 4.21AFEE304 pKa = 4.77KK305 pKa = 10.13NSQVISSTVADD316 pKa = 5.42FAAQLPIPQSS326 pKa = 3.23
MM1 pKa = 7.53RR2 pKa = 11.84TRR4 pKa = 11.84TLLAGAATVVVATGMAVPAAVVAAPSPDD32 pKa = 3.48YY33 pKa = 10.69SAPAAMTHH41 pKa = 5.22LQEE44 pKa = 4.69LDD46 pKa = 3.59RR47 pKa = 11.84IAAEE51 pKa = 4.05NGGNRR56 pKa = 11.84AVGTPGYY63 pKa = 9.44EE64 pKa = 3.59AALDD68 pKa = 3.97YY69 pKa = 10.95VQQQLDD75 pKa = 3.27QAGFVTTRR83 pKa = 11.84QEE85 pKa = 3.71FTYY88 pKa = 10.84GGTTTWNLLAEE99 pKa = 4.55TEE101 pKa = 4.53GGNADD106 pKa = 3.43NTVVVGAHH114 pKa = 6.52LDD116 pKa = 3.88GVEE119 pKa = 4.23SGHH122 pKa = 7.03GINDD126 pKa = 3.59NGSGSAAVLNSALQYY141 pKa = 10.6AEE143 pKa = 4.82SGAEE147 pKa = 3.84PANKK151 pKa = 9.73LRR153 pKa = 11.84FAFWGAEE160 pKa = 3.92EE161 pKa = 4.22VGLVGSTHH169 pKa = 6.03YY170 pKa = 11.31VDD172 pKa = 4.02TLSQQEE178 pKa = 3.82RR179 pKa = 11.84DD180 pKa = 3.76QIAMYY185 pKa = 10.65LNYY188 pKa = 11.24DD189 pKa = 3.5MVGSNNAGYY198 pKa = 7.86FTYY201 pKa = 10.71DD202 pKa = 3.2GDD204 pKa = 4.48DD205 pKa = 3.48SDD207 pKa = 5.57GVGAGPGPDD216 pKa = 3.12GSAEE220 pKa = 3.88IEE222 pKa = 4.16QALNDD227 pKa = 4.19ALSGAGVEE235 pKa = 4.3PDD237 pKa = 3.12GTDD240 pKa = 3.37FDD242 pKa = 4.22GRR244 pKa = 11.84SDD246 pKa = 3.81YY247 pKa = 11.58GPFIEE252 pKa = 5.33VGIPSGGIFTGAEE265 pKa = 3.33GRR267 pKa = 11.84MTQEE271 pKa = 5.17QAQKK275 pKa = 8.44WNGRR279 pKa = 11.84AGEE282 pKa = 4.51PYY284 pKa = 10.08DD285 pKa = 3.68ACYY288 pKa = 10.04HH289 pKa = 5.06QACDD293 pKa = 5.9DD294 pKa = 4.2LDD296 pKa = 3.94NLNNEE301 pKa = 4.21AFEE304 pKa = 4.77KK305 pKa = 10.13NSQVISSTVADD316 pKa = 5.42FAAQLPIPQSS326 pKa = 3.23
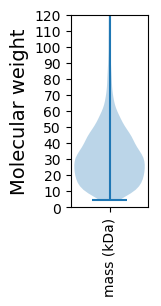
Molecular weight: 33.98 kDa
Isoelectric point according different methods:
Protein with the highest isoelectric point:
>tr|A0A5Q3QC39|A0A5Q3QC39_9PSEU RDD family protein OS=Saccharopolyspora coralli OX=2665642 GN=GIY23_07460 PE=4 SV=1
MM1 pKa = 7.69SKK3 pKa = 9.0RR4 pKa = 11.84TFQPNNRR11 pKa = 11.84KK12 pKa = 8.98RR13 pKa = 11.84AKK15 pKa = 8.46THH17 pKa = 5.11GFRR20 pKa = 11.84LRR22 pKa = 11.84MRR24 pKa = 11.84TRR26 pKa = 11.84AGRR29 pKa = 11.84AIVAARR35 pKa = 11.84RR36 pKa = 11.84RR37 pKa = 11.84RR38 pKa = 11.84GRR40 pKa = 11.84NKK42 pKa = 9.17LTAA45 pKa = 4.19
MM1 pKa = 7.69SKK3 pKa = 9.0RR4 pKa = 11.84TFQPNNRR11 pKa = 11.84KK12 pKa = 8.98RR13 pKa = 11.84AKK15 pKa = 8.46THH17 pKa = 5.11GFRR20 pKa = 11.84LRR22 pKa = 11.84MRR24 pKa = 11.84TRR26 pKa = 11.84AGRR29 pKa = 11.84AIVAARR35 pKa = 11.84RR36 pKa = 11.84RR37 pKa = 11.84RR38 pKa = 11.84GRR40 pKa = 11.84NKK42 pKa = 9.17LTAA45 pKa = 4.19
Molecular weight: 5.35 kDa
Isoelectric point according different methods:
Peptides (in silico digests for buttom-up proteomics)
Below you can find in silico digests of the whole proteome with Trypsin, Chymotrypsin, Trypsin+LysC, LysN, ArgC proteases suitable for different mass spec machines.| Try ESI |
 |
|---|
| ChTry ESI |
|
|---|
| ArgC ESI |
|
|---|
| LysN ESI |
|
|---|
| TryLysC ESI |
|
|---|
| Try MALDI |
|
|---|
| ChTry MALDI |
|
|---|
| ArgC MALDI |
|
|---|
| LysN MALDI |
|
|---|
| TryLysC MALDI |
|
|---|
| Try LTQ |
|
|---|
| ChTry LTQ |
|
|---|
| ArgC LTQ |
|
|---|
| LysN LTQ |
|
|---|
| TryLysC LTQ |
|
|---|
| Try MSlow |
|
|---|
| ChTry MSlow |
|
|---|
| ArgC MSlow |
|
|---|
| LysN MSlow |
|
|---|
| TryLysC MSlow |
|
|---|
| Try MShigh |
|
|---|
| ChTry MShigh |
|
|---|
| ArgC MShigh |
|
|---|
| LysN MShigh |
|
|---|
| TryLysC MShigh |
|
|---|
General Statistics
Number of major isoforms |
Number of additional isoforms |
Number of all proteins |
Number of amino acids |
Min. Seq. Length |
Max. Seq. Length |
Avg. Seq. Length |
Avg. Mol. Weight |
|---|---|---|---|---|---|---|---|
0 |
1342545 |
33 |
2035 |
312.5 |
33.61 |
Amino acid frequency
Ala |
Cys |
Asp |
Glu |
Phe |
Gly |
His |
Ile |
Lys |
Leu |
|---|---|---|---|---|---|---|---|---|---|
12.422 ± 0.044 | 0.833 ± 0.01 |
6.341 ± 0.037 | 6.125 ± 0.035 |
2.835 ± 0.022 | 9.144 ± 0.036 |
2.429 ± 0.023 | 3.205 ± 0.026 |
1.876 ± 0.026 | 10.103 ± 0.043 |
Met |
Asn |
Gln |
Pro |
Arg |
Ser |
Thr |
Val |
Trp |
Tyr |
|---|---|---|---|---|---|---|---|---|---|
1.863 ± 0.014 | 1.902 ± 0.019 |
5.716 ± 0.033 | 3.089 ± 0.023 |
7.892 ± 0.042 | 5.564 ± 0.024 |
6.104 ± 0.027 | 9.187 ± 0.042 |
1.489 ± 0.017 | 1.88 ± 0.016 |
Most of the basic statistics you can see at this page can be downloaded from this CSV file
See this proteome in:

Proteome-pI is available under Creative Commons Attribution-NoDerivs license, for more details see here
| Reference: Kozlowski LP. Proteome-pI 2.0: Proteome Isoelectric Point Database Update. Nucleic Acids Res. 2021, doi: 10.1093/nar/gkab944 | Contact: Lukasz P. Kozlowski |