Streptomyces davaonensis (strain DSM 101723 / JCM 4913 / KCC S-0913 / 768)
Taxonomy: cellular organisms; Bacteria; Terrabacteria group; Actinobacteria; Actinomycetia; Streptomycetales; Streptomycetaceae; Streptomyces; Streptomyces davaonensis
Average proteome isoelectric point is 6.24
Get precalculated fractions of proteins

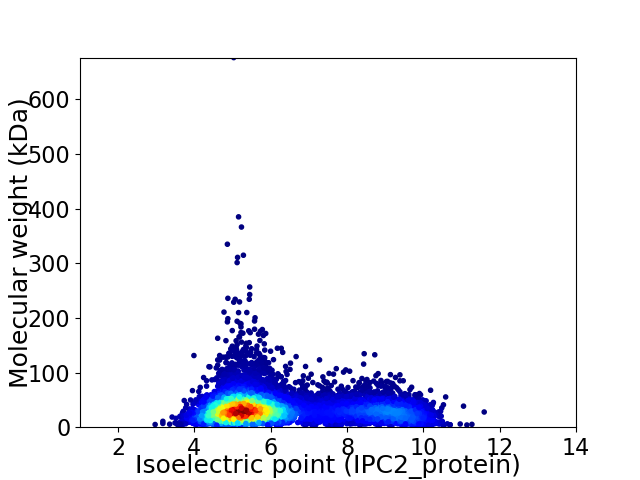
Virtual 2D-PAGE plot for 8553 proteins (isoelectric point calculated using IPC2_protein)
Get csv file with sequences according to given criteria:
* You can choose from 21 different methods for calculating isoelectric point
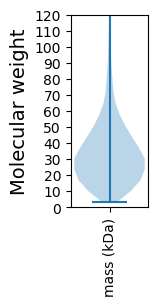
Summary statistics related to proteome-wise predictions


Protein with the lowest isoelectric point:
>tr|K4R718|K4R718_STRDJ Glyco_trans_2-like domain-containing protein OS=Streptomyces davaonensis (strain DSM 101723 / JCM 4913 / KCC S-0913 / 768) OX=1214101 GN=BN159_4513 PE=4 SV=1
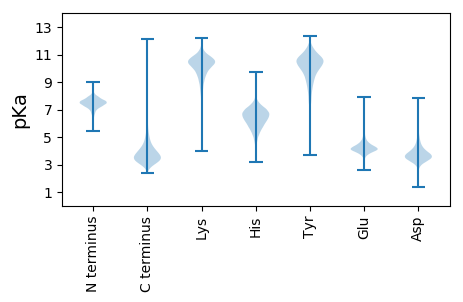
MM1 pKa = 7.06TQFPTLIDD9 pKa = 3.43QVAAAVLAPAQVTEE23 pKa = 4.46NPHH26 pKa = 5.34HH27 pKa = 6.64RR28 pKa = 11.84AILDD32 pKa = 3.6VFVEE36 pKa = 4.13IQDD39 pKa = 4.29LDD41 pKa = 3.65RR42 pKa = 11.84QLAEE46 pKa = 3.99LAGAEE51 pKa = 4.17LPGVSPAEE59 pKa = 3.96QLNTLTDD66 pKa = 4.07LLVEE70 pKa = 4.57RR71 pKa = 11.84MAAGADD77 pKa = 3.88LSALLATSCCCAAAYY92 pKa = 7.8EE93 pKa = 4.54AGPSAEE99 pKa = 4.45YY100 pKa = 10.71EE101 pKa = 4.12PLDD104 pKa = 4.28DD105 pKa = 4.93EE106 pKa = 5.45EE107 pKa = 6.04PGFDD111 pKa = 4.26PDD113 pKa = 4.33FDD115 pKa = 4.35DD116 pKa = 6.84FEE118 pKa = 6.15GFDD121 pKa = 4.2DD122 pKa = 5.03FEE124 pKa = 4.9EE125 pKa = 5.29PGDD128 pKa = 4.73LDD130 pKa = 5.77DD131 pKa = 7.1FDD133 pKa = 5.92DD134 pKa = 4.09LHH136 pKa = 7.37EE137 pKa = 4.8DD138 pKa = 3.14ACEE141 pKa = 3.97EE142 pKa = 4.15FLSCPSGPQTIVHH155 pKa = 6.7ACLAVFDD162 pKa = 5.31DD163 pKa = 4.67EE164 pKa = 4.85GAPEE168 pKa = 4.07YY169 pKa = 11.1VSAAEE174 pKa = 3.87LVEE177 pKa = 4.13RR178 pKa = 11.84LRR180 pKa = 11.84DD181 pKa = 3.55LPGQAEE187 pKa = 4.54GRR189 pKa = 11.84WSYY192 pKa = 12.24ADD194 pKa = 3.69LTPLRR199 pKa = 11.84LGLLLRR205 pKa = 11.84GYY207 pKa = 10.08GVQPCNPRR215 pKa = 11.84AADD218 pKa = 3.76GSRR221 pKa = 11.84YY222 pKa = 8.93RR223 pKa = 11.84AYY225 pKa = 10.62RR226 pKa = 11.84RR227 pKa = 11.84ADD229 pKa = 3.55LLAARR234 pKa = 11.84PNCSCC239 pKa = 4.98
MM1 pKa = 7.06TQFPTLIDD9 pKa = 3.43QVAAAVLAPAQVTEE23 pKa = 4.46NPHH26 pKa = 5.34HH27 pKa = 6.64RR28 pKa = 11.84AILDD32 pKa = 3.6VFVEE36 pKa = 4.13IQDD39 pKa = 4.29LDD41 pKa = 3.65RR42 pKa = 11.84QLAEE46 pKa = 3.99LAGAEE51 pKa = 4.17LPGVSPAEE59 pKa = 3.96QLNTLTDD66 pKa = 4.07LLVEE70 pKa = 4.57RR71 pKa = 11.84MAAGADD77 pKa = 3.88LSALLATSCCCAAAYY92 pKa = 7.8EE93 pKa = 4.54AGPSAEE99 pKa = 4.45YY100 pKa = 10.71EE101 pKa = 4.12PLDD104 pKa = 4.28DD105 pKa = 4.93EE106 pKa = 5.45EE107 pKa = 6.04PGFDD111 pKa = 4.26PDD113 pKa = 4.33FDD115 pKa = 4.35DD116 pKa = 6.84FEE118 pKa = 6.15GFDD121 pKa = 4.2DD122 pKa = 5.03FEE124 pKa = 4.9EE125 pKa = 5.29PGDD128 pKa = 4.73LDD130 pKa = 5.77DD131 pKa = 7.1FDD133 pKa = 5.92DD134 pKa = 4.09LHH136 pKa = 7.37EE137 pKa = 4.8DD138 pKa = 3.14ACEE141 pKa = 3.97EE142 pKa = 4.15FLSCPSGPQTIVHH155 pKa = 6.7ACLAVFDD162 pKa = 5.31DD163 pKa = 4.67EE164 pKa = 4.85GAPEE168 pKa = 4.07YY169 pKa = 11.1VSAAEE174 pKa = 3.87LVEE177 pKa = 4.13RR178 pKa = 11.84LRR180 pKa = 11.84DD181 pKa = 3.55LPGQAEE187 pKa = 4.54GRR189 pKa = 11.84WSYY192 pKa = 12.24ADD194 pKa = 3.69LTPLRR199 pKa = 11.84LGLLLRR205 pKa = 11.84GYY207 pKa = 10.08GVQPCNPRR215 pKa = 11.84AADD218 pKa = 3.76GSRR221 pKa = 11.84YY222 pKa = 8.93RR223 pKa = 11.84AYY225 pKa = 10.62RR226 pKa = 11.84RR227 pKa = 11.84ADD229 pKa = 3.55LLAARR234 pKa = 11.84PNCSCC239 pKa = 4.98
Molecular weight: 25.92 kDa
Isoelectric point according different methods:
Protein with the highest isoelectric point:
>tr|K4R799|K4R799_STRDJ Integral membrane protein OS=Streptomyces davaonensis (strain DSM 101723 / JCM 4913 / KCC S-0913 / 768) OX=1214101 GN=BN159_4849 PE=4 SV=1
MM1 pKa = 7.69SKK3 pKa = 9.0RR4 pKa = 11.84TFQPNNRR11 pKa = 11.84RR12 pKa = 11.84RR13 pKa = 11.84AKK15 pKa = 8.7THH17 pKa = 5.15GFRR20 pKa = 11.84LRR22 pKa = 11.84MRR24 pKa = 11.84TRR26 pKa = 11.84AGRR29 pKa = 11.84AILANRR35 pKa = 11.84RR36 pKa = 11.84AKK38 pKa = 10.46GRR40 pKa = 11.84ASLSAA45 pKa = 3.83
MM1 pKa = 7.69SKK3 pKa = 9.0RR4 pKa = 11.84TFQPNNRR11 pKa = 11.84RR12 pKa = 11.84RR13 pKa = 11.84AKK15 pKa = 8.7THH17 pKa = 5.15GFRR20 pKa = 11.84LRR22 pKa = 11.84MRR24 pKa = 11.84TRR26 pKa = 11.84AGRR29 pKa = 11.84AILANRR35 pKa = 11.84RR36 pKa = 11.84AKK38 pKa = 10.46GRR40 pKa = 11.84ASLSAA45 pKa = 3.83
Molecular weight: 5.22 kDa
Isoelectric point according different methods:
Peptides (in silico digests for buttom-up proteomics)
Below you can find in silico digests of the whole proteome with Trypsin, Chymotrypsin, Trypsin+LysC, LysN, ArgC proteases suitable for different mass spec machines.| Try ESI |
 |
|---|
| ChTry ESI |
 |
|---|
| ArgC ESI |
 |
|---|
| LysN ESI |
 |
|---|
| TryLysC ESI |
 |
|---|
| Try MALDI |
 |
|---|
| ChTry MALDI |
 |
|---|
| ArgC MALDI |
 |
|---|
| LysN MALDI |
 |
|---|
| TryLysC MALDI |
 |
|---|
| Try LTQ |
 |
|---|
| ChTry LTQ |
 |
|---|
| ArgC LTQ |
 |
|---|
| LysN LTQ |
 |
|---|
| TryLysC LTQ |
 |
|---|
| Try MSlow |
 |
|---|
| ChTry MSlow |
 |
|---|
| ArgC MSlow |
 |
|---|
| LysN MSlow |
 |
|---|
| TryLysC MSlow |
 |
|---|
| Try MShigh |
 |
|---|
| ChTry MShigh |
 |
|---|
| ArgC MShigh |
 |
|---|
| LysN MShigh |
 |
|---|
| TryLysC MShigh |
 |
|---|
General Statistics
Number of major isoforms |
Number of additional isoforms |
Number of all proteins |
Number of amino acids |
Min. Seq. Length |
Max. Seq. Length |
Avg. Seq. Length |
Avg. Mol. Weight |
|---|---|---|---|---|---|---|---|
0 |
2841216 |
28 |
6221 |
332.2 |
35.7 |
Amino acid frequency
Ala |
Cys |
Asp |
Glu |
Phe |
Gly |
His |
Ile |
Lys |
Leu |
|---|---|---|---|---|---|---|---|---|---|
13.269 ± 0.041 | 0.797 ± 0.007 |
6.063 ± 0.021 | 5.88 ± 0.022 |
2.742 ± 0.016 | 9.195 ± 0.023 |
2.338 ± 0.012 | 3.192 ± 0.02 |
2.204 ± 0.023 | 10.466 ± 0.039 |
Met |
Asn |
Gln |
Pro |
Arg |
Ser |
Thr |
Val |
Trp |
Tyr |
|---|---|---|---|---|---|---|---|---|---|
1.715 ± 0.012 | 1.826 ± 0.015 |
6.07 ± 0.027 | 2.829 ± 0.015 |
7.982 ± 0.032 | 5.101 ± 0.019 |
6.237 ± 0.021 | 8.361 ± 0.027 |
1.585 ± 0.011 | 2.148 ± 0.014 |
Most of the basic statistics you can see at this page can be downloaded from this CSV file
Proteome-pI is available under Creative Commons Attribution-NoDerivs license, for more details see here
| Reference: Kozlowski LP. Proteome-pI 2.0: Proteome Isoelectric Point Database Update. Nucleic Acids Res. 2021, doi: 10.1093/nar/gkab944 | Contact: Lukasz P. Kozlowski |
