Cryptococcus depauperatus CBS 7841
Taxonomy: cellular organisms; Eukaryota; Opisthokonta; Fungi; Dikarya; Basidiomycota; Agaricomycotina; Tremellomycetes; Tremellales; Cryptococcaceae; Cryptococcus; Cryptococcus depauperatus
Average proteome isoelectric point is 6.7
Get precalculated fractions of proteins

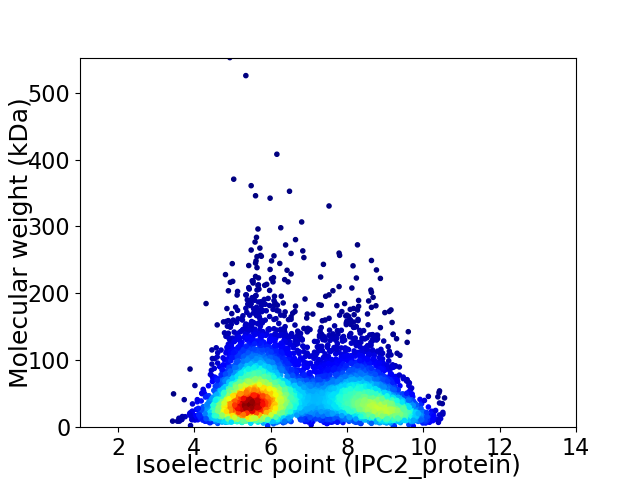
Virtual 2D-PAGE plot for 6530 proteins (isoelectric point calculated using IPC2_protein)
Get csv file with sequences according to given criteria:
* You can choose from 21 different methods for calculating isoelectric point
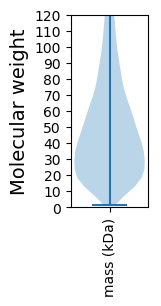
Summary statistics related to proteome-wise predictions


Protein with the lowest isoelectric point:
>tr|A0A1E3HV80|A0A1E3HV80_9TREE Ribosomal RNA-processing protein 1 OS=Cryptococcus depauperatus CBS 7841 OX=1295531 GN=L203_05835 PE=4 SV=1
MM1 pKa = 7.89PSHH4 pKa = 7.18FVPTTPSSGYY14 pKa = 10.62SPDD17 pKa = 4.13SPSQTNSDD25 pKa = 3.81QPRR28 pKa = 11.84VILMPVSEE36 pKa = 4.73SSLGGDD42 pKa = 3.49GDD44 pKa = 4.24ALSSVLTIDD53 pKa = 4.25PYY55 pKa = 10.93IATSPYY61 pKa = 8.69DD62 pKa = 3.56TAGSSVPSSTTATLCLIVLISDD84 pKa = 3.52DD85 pKa = 3.8TTGNNSPISPSITTDD100 pKa = 3.16SASTPNKK107 pKa = 10.26RR108 pKa = 11.84LDD110 pKa = 3.61PDD112 pKa = 3.31
MM1 pKa = 7.89PSHH4 pKa = 7.18FVPTTPSSGYY14 pKa = 10.62SPDD17 pKa = 4.13SPSQTNSDD25 pKa = 3.81QPRR28 pKa = 11.84VILMPVSEE36 pKa = 4.73SSLGGDD42 pKa = 3.49GDD44 pKa = 4.24ALSSVLTIDD53 pKa = 4.25PYY55 pKa = 10.93IATSPYY61 pKa = 8.69DD62 pKa = 3.56TAGSSVPSSTTATLCLIVLISDD84 pKa = 3.52DD85 pKa = 3.8TTGNNSPISPSITTDD100 pKa = 3.16SASTPNKK107 pKa = 10.26RR108 pKa = 11.84LDD110 pKa = 3.61PDD112 pKa = 3.31
Molecular weight: 11.47 kDa
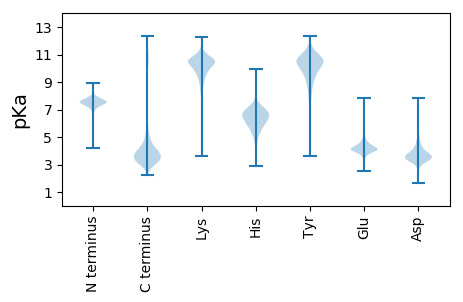
Isoelectric point according different methods:
Protein with the highest isoelectric point:
>tr|A0A1E3HSC4|A0A1E3HSC4_9TREE CAP10 domain-containing protein OS=Cryptococcus depauperatus CBS 7841 OX=1295531 GN=L203_06032 PE=4 SV=1
MM1 pKa = 7.52ASAVGRR7 pKa = 11.84TVSRR11 pKa = 11.84LKK13 pKa = 10.96AVGLAGKK20 pKa = 8.57PATAQPTDD28 pKa = 3.16HH29 pKa = 7.05GIVDD33 pKa = 4.25GLFKK37 pKa = 10.28MEE39 pKa = 4.23KK40 pKa = 6.86TTSISPNAYY49 pKa = 10.15NKK51 pKa = 10.09FGPTLTSTRR60 pKa = 11.84HH61 pKa = 5.63KK62 pKa = 9.55QTQPYY67 pKa = 8.91SAEE70 pKa = 4.19SVDD73 pKa = 4.97SKK75 pKa = 11.3GLQNITYY82 pKa = 9.35SYY84 pKa = 10.31RR85 pKa = 11.84DD86 pKa = 3.35EE87 pKa = 4.23AHH89 pKa = 6.43RR90 pKa = 11.84QSPQPNPVTEE100 pKa = 4.26CFRR103 pKa = 11.84IAVIIPPPPIARR115 pKa = 11.84KK116 pKa = 6.61MTARR120 pKa = 11.84NGVPRR125 pKa = 11.84VSSLRR130 pKa = 11.84RR131 pKa = 11.84TISKK135 pKa = 10.05HH136 pKa = 4.46VEE138 pKa = 3.33VWPINRR144 pKa = 11.84FEE146 pKa = 4.24VQTAHH151 pKa = 6.28CVVRR155 pKa = 11.84SIRR158 pKa = 11.84SGTCRR163 pKa = 11.84HH164 pKa = 6.53IYY166 pKa = 9.05FICNSFGILHH176 pKa = 6.48TSRR179 pKa = 11.84GPSIRR184 pKa = 11.84CLIRR188 pKa = 5.25
MM1 pKa = 7.52ASAVGRR7 pKa = 11.84TVSRR11 pKa = 11.84LKK13 pKa = 10.96AVGLAGKK20 pKa = 8.57PATAQPTDD28 pKa = 3.16HH29 pKa = 7.05GIVDD33 pKa = 4.25GLFKK37 pKa = 10.28MEE39 pKa = 4.23KK40 pKa = 6.86TTSISPNAYY49 pKa = 10.15NKK51 pKa = 10.09FGPTLTSTRR60 pKa = 11.84HH61 pKa = 5.63KK62 pKa = 9.55QTQPYY67 pKa = 8.91SAEE70 pKa = 4.19SVDD73 pKa = 4.97SKK75 pKa = 11.3GLQNITYY82 pKa = 9.35SYY84 pKa = 10.31RR85 pKa = 11.84DD86 pKa = 3.35EE87 pKa = 4.23AHH89 pKa = 6.43RR90 pKa = 11.84QSPQPNPVTEE100 pKa = 4.26CFRR103 pKa = 11.84IAVIIPPPPIARR115 pKa = 11.84KK116 pKa = 6.61MTARR120 pKa = 11.84NGVPRR125 pKa = 11.84VSSLRR130 pKa = 11.84RR131 pKa = 11.84TISKK135 pKa = 10.05HH136 pKa = 4.46VEE138 pKa = 3.33VWPINRR144 pKa = 11.84FEE146 pKa = 4.24VQTAHH151 pKa = 6.28CVVRR155 pKa = 11.84SIRR158 pKa = 11.84SGTCRR163 pKa = 11.84HH164 pKa = 6.53IYY166 pKa = 9.05FICNSFGILHH176 pKa = 6.48TSRR179 pKa = 11.84GPSIRR184 pKa = 11.84CLIRR188 pKa = 5.25
Molecular weight: 20.85 kDa
Isoelectric point according different methods:
Peptides (in silico digests for buttom-up proteomics)
Below you can find in silico digests of the whole proteome with Trypsin, Chymotrypsin, Trypsin+LysC, LysN, ArgC proteases suitable for different mass spec machines.| Try ESI |
 |
|---|
| ChTry ESI |
 |
|---|
| ArgC ESI |
 |
|---|
| LysN ESI |
 |
|---|
| TryLysC ESI |
 |
|---|
| Try MALDI |
 |
|---|
| ChTry MALDI |
 |
|---|
| ArgC MALDI |
 |
|---|
| LysN MALDI |
 |
|---|
| TryLysC MALDI |
 |
|---|
| Try LTQ |
 |
|---|
| ChTry LTQ |
 |
|---|
| ArgC LTQ |
 |
|---|
| LysN LTQ |
 |
|---|
| TryLysC LTQ |
 |
|---|
| Try MSlow |
 |
|---|
| ChTry MSlow |
 |
|---|
| ArgC MSlow |
 |
|---|
| LysN MSlow |
 |
|---|
| TryLysC MSlow |
 |
|---|
| Try MShigh |
 |
|---|
| ChTry MShigh |
 |
|---|
| ArgC MShigh |
 |
|---|
| LysN MShigh |
 |
|---|
| TryLysC MShigh |
 |
|---|
General Statistics
Number of major isoforms |
Number of additional isoforms |
Number of all proteins |
Number of amino acids |
Min. Seq. Length |
Max. Seq. Length |
Avg. Seq. Length |
Avg. Mol. Weight |
|---|---|---|---|---|---|---|---|
0 |
3229921 |
14 |
4945 |
494.6 |
54.77 |
Amino acid frequency
Ala |
Cys |
Asp |
Glu |
Phe |
Gly |
His |
Ile |
Lys |
Leu |
|---|---|---|---|---|---|---|---|---|---|
7.732 ± 0.023 | 1.089 ± 0.011 |
5.349 ± 0.019 | 6.51 ± 0.028 |
3.443 ± 0.017 | 6.601 ± 0.03 |
2.402 ± 0.012 | 5.12 ± 0.021 |
5.478 ± 0.027 | 9.192 ± 0.033 |
Met |
Asn |
Gln |
Pro |
Arg |
Ser |
Thr |
Val |
Trp |
Tyr |
|---|---|---|---|---|---|---|---|---|---|
2.156 ± 0.009 | 3.757 ± 0.012 |
6.196 ± 0.032 | 4.058 ± 0.022 |
5.915 ± 0.022 | 9.225 ± 0.04 |
5.863 ± 0.018 | 6.007 ± 0.021 |
1.351 ± 0.012 | 2.556 ± 0.014 |
Most of the basic statistics you can see at this page can be downloaded from this CSV file
Proteome-pI is available under Creative Commons Attribution-NoDerivs license, for more details see here
| Reference: Kozlowski LP. Proteome-pI 2.0: Proteome Isoelectric Point Database Update. Nucleic Acids Res. 2021, doi: 10.1093/nar/gkab944 | Contact: Lukasz P. Kozlowski |
