Bifidobacterium pullorum subsp. gallinarum
Taxonomy: cellular organisms;
Average proteome isoelectric point is 5.87
Get precalculated fractions of proteins

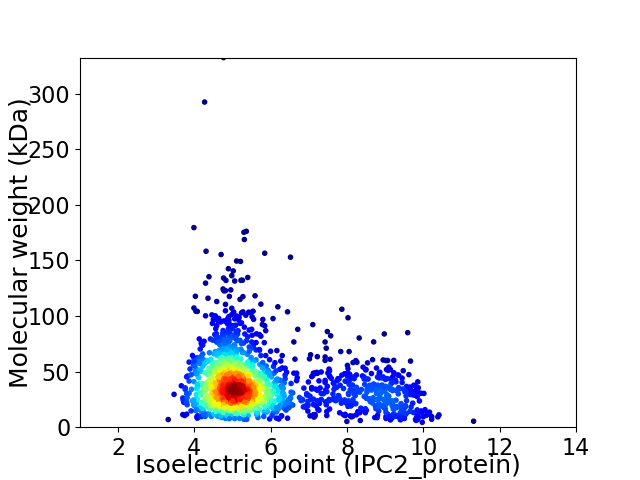
Virtual 2D-PAGE plot for 1652 proteins (isoelectric point calculated using IPC2_protein)
Get csv file with sequences according to given criteria:
* You can choose from 21 different methods for calculating isoelectric point
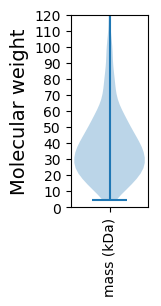
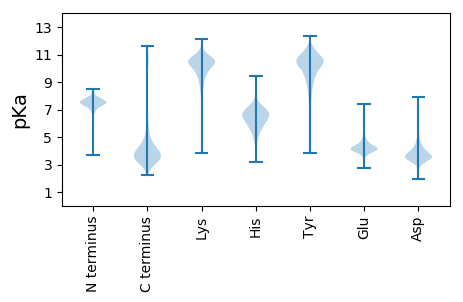
Summary statistics related to proteome-wise predictions


Protein with the lowest isoelectric point:
>tr|A0A087AN30|A0A087AN30_9BIFI Glutaredoxin nrdH OS=Bifidobacterium pullorum subsp. gallinarum OX=78344 GN=BIGA_1684 PE=4 SV=1
MM1 pKa = 7.15TGNMGGSGMRR11 pKa = 11.84RR12 pKa = 11.84GVMVVIGVVAVVVSLVAGCAVGVGIAYY39 pKa = 10.58VMGNRR44 pKa = 11.84DD45 pKa = 2.99GHH47 pKa = 7.4ALVADD52 pKa = 4.47SAADD56 pKa = 3.83GAGTSSDD63 pKa = 3.39TGADD67 pKa = 3.18ADD69 pKa = 4.44GRR71 pKa = 11.84DD72 pKa = 3.78DD73 pKa = 4.5AAAGDD78 pKa = 4.33SASGDD83 pKa = 3.23VDD85 pKa = 4.17FEE87 pKa = 4.54SGRR90 pKa = 11.84DD91 pKa = 3.68DD92 pKa = 5.93DD93 pKa = 5.59GDD95 pKa = 4.13AVDD98 pKa = 5.61GDD100 pKa = 4.82DD101 pKa = 4.21SRR103 pKa = 11.84QSASQADD110 pKa = 4.24DD111 pKa = 3.82SDD113 pKa = 4.61HH114 pKa = 6.08CAAWVGMYY122 pKa = 7.65YY123 pKa = 10.14TLGDD127 pKa = 3.3ARR129 pKa = 11.84DD130 pKa = 3.89YY131 pKa = 11.86VDD133 pKa = 5.23LKK135 pKa = 10.83SGCGGSGLMSRR146 pKa = 11.84GMWPKK151 pKa = 9.47LTYY154 pKa = 10.61DD155 pKa = 3.55PGSFVDD161 pKa = 4.18EE162 pKa = 4.55GNGRR166 pKa = 11.84YY167 pKa = 9.28SWTVTSKK174 pKa = 7.88MTYY177 pKa = 10.2DD178 pKa = 3.77PQQTDD183 pKa = 3.93PEE185 pKa = 4.21DD186 pKa = 3.2QAYY189 pKa = 10.75CDD191 pKa = 4.1GQPTTSRR198 pKa = 11.84SFEE201 pKa = 4.33VIPTDD206 pKa = 3.48QSPTGVILHH215 pKa = 6.8DD216 pKa = 3.75TTPGIDD222 pKa = 3.2QTSAQSYY229 pKa = 6.9YY230 pKa = 11.24APDD233 pKa = 4.86GYY235 pKa = 9.6TGGMPQQ241 pKa = 3.59
MM1 pKa = 7.15TGNMGGSGMRR11 pKa = 11.84RR12 pKa = 11.84GVMVVIGVVAVVVSLVAGCAVGVGIAYY39 pKa = 10.58VMGNRR44 pKa = 11.84DD45 pKa = 2.99GHH47 pKa = 7.4ALVADD52 pKa = 4.47SAADD56 pKa = 3.83GAGTSSDD63 pKa = 3.39TGADD67 pKa = 3.18ADD69 pKa = 4.44GRR71 pKa = 11.84DD72 pKa = 3.78DD73 pKa = 4.5AAAGDD78 pKa = 4.33SASGDD83 pKa = 3.23VDD85 pKa = 4.17FEE87 pKa = 4.54SGRR90 pKa = 11.84DD91 pKa = 3.68DD92 pKa = 5.93DD93 pKa = 5.59GDD95 pKa = 4.13AVDD98 pKa = 5.61GDD100 pKa = 4.82DD101 pKa = 4.21SRR103 pKa = 11.84QSASQADD110 pKa = 4.24DD111 pKa = 3.82SDD113 pKa = 4.61HH114 pKa = 6.08CAAWVGMYY122 pKa = 7.65YY123 pKa = 10.14TLGDD127 pKa = 3.3ARR129 pKa = 11.84DD130 pKa = 3.89YY131 pKa = 11.86VDD133 pKa = 5.23LKK135 pKa = 10.83SGCGGSGLMSRR146 pKa = 11.84GMWPKK151 pKa = 9.47LTYY154 pKa = 10.61DD155 pKa = 3.55PGSFVDD161 pKa = 4.18EE162 pKa = 4.55GNGRR166 pKa = 11.84YY167 pKa = 9.28SWTVTSKK174 pKa = 7.88MTYY177 pKa = 10.2DD178 pKa = 3.77PQQTDD183 pKa = 3.93PEE185 pKa = 4.21DD186 pKa = 3.2QAYY189 pKa = 10.75CDD191 pKa = 4.1GQPTTSRR198 pKa = 11.84SFEE201 pKa = 4.33VIPTDD206 pKa = 3.48QSPTGVILHH215 pKa = 6.8DD216 pKa = 3.75TTPGIDD222 pKa = 3.2QTSAQSYY229 pKa = 6.9YY230 pKa = 11.24APDD233 pKa = 4.86GYY235 pKa = 9.6TGGMPQQ241 pKa = 3.59
Molecular weight: 24.84 kDa
Isoelectric point according different methods:
Protein with the highest isoelectric point:
>tr|A0A087AN49|A0A087AN49_9BIFI Major facilitator superfamily protein OS=Bifidobacterium pullorum subsp. gallinarum OX=78344 GN=BIGA_1702 PE=4 SV=1
MM1 pKa = 7.44KK2 pKa = 9.6RR3 pKa = 11.84TFQPNNRR10 pKa = 11.84RR11 pKa = 11.84RR12 pKa = 11.84HH13 pKa = 4.82MKK15 pKa = 9.64HH16 pKa = 5.7GFRR19 pKa = 11.84LRR21 pKa = 11.84MRR23 pKa = 11.84TRR25 pKa = 11.84SGRR28 pKa = 11.84AVINRR33 pKa = 11.84RR34 pKa = 11.84RR35 pKa = 11.84AKK37 pKa = 10.06GRR39 pKa = 11.84KK40 pKa = 8.87SLSAA44 pKa = 3.86
MM1 pKa = 7.44KK2 pKa = 9.6RR3 pKa = 11.84TFQPNNRR10 pKa = 11.84RR11 pKa = 11.84RR12 pKa = 11.84HH13 pKa = 4.82MKK15 pKa = 9.64HH16 pKa = 5.7GFRR19 pKa = 11.84LRR21 pKa = 11.84MRR23 pKa = 11.84TRR25 pKa = 11.84SGRR28 pKa = 11.84AVINRR33 pKa = 11.84RR34 pKa = 11.84RR35 pKa = 11.84AKK37 pKa = 10.06GRR39 pKa = 11.84KK40 pKa = 8.87SLSAA44 pKa = 3.86
Molecular weight: 5.38 kDa
Isoelectric point according different methods:
Peptides (in silico digests for buttom-up proteomics)
Below you can find in silico digests of the whole proteome with Trypsin, Chymotrypsin, Trypsin+LysC, LysN, ArgC proteases suitable for different mass spec machines.| Try ESI |
 |
|---|
| ChTry ESI |
 |
|---|
| ArgC ESI |
 |
|---|
| LysN ESI |
 |
|---|
| TryLysC ESI |
 |
|---|
| Try MALDI |
 |
|---|
| ChTry MALDI |
 |
|---|
| ArgC MALDI |
 |
|---|
| LysN MALDI |
 |
|---|
| TryLysC MALDI |
 |
|---|
| Try LTQ |
 |
|---|
| ChTry LTQ |
 |
|---|
| ArgC LTQ |
 |
|---|
| LysN LTQ |
 |
|---|
| TryLysC LTQ |
 |
|---|
| Try MSlow |
 |
|---|
| ChTry MSlow |
 |
|---|
| ArgC MSlow |
 |
|---|
| LysN MSlow |
 |
|---|
| TryLysC MSlow |
 |
|---|
| Try MShigh |
 |
|---|
| ChTry MShigh |
 |
|---|
| ArgC MShigh |
 |
|---|
| LysN MShigh |
 |
|---|
| TryLysC MShigh |
 |
|---|
General Statistics
Number of major isoforms |
Number of additional isoforms |
Number of all proteins |
Number of amino acids |
Min. Seq. Length |
Max. Seq. Length |
Avg. Seq. Length |
Avg. Mol. Weight |
|---|---|---|---|---|---|---|---|
0 |
621777 |
37 |
3126 |
376.4 |
41.08 |
Amino acid frequency
Ala |
Cys |
Asp |
Glu |
Phe |
Gly |
His |
Ile |
Lys |
Leu |
|---|---|---|---|---|---|---|---|---|---|
11.272 ± 0.073 | 0.991 ± 0.02 |
6.785 ± 0.043 | 5.934 ± 0.054 |
3.343 ± 0.035 | 8.229 ± 0.056 |
2.14 ± 0.028 | 5.199 ± 0.044 |
3.064 ± 0.047 | 8.895 ± 0.057 |
Met |
Asn |
Gln |
Pro |
Arg |
Ser |
Thr |
Val |
Trp |
Tyr |
|---|---|---|---|---|---|---|---|---|---|
2.659 ± 0.025 | 3.003 ± 0.038 |
4.803 ± 0.036 | 3.291 ± 0.033 |
6.675 ± 0.068 | 5.556 ± 0.043 |
5.955 ± 0.042 | 8.064 ± 0.045 |
1.396 ± 0.026 | 2.746 ± 0.036 |
Most of the basic statistics you can see at this page can be downloaded from this CSV file
Proteome-pI is available under Creative Commons Attribution-NoDerivs license, for more details see here
| Reference: Kozlowski LP. Proteome-pI 2.0: Proteome Isoelectric Point Database Update. Nucleic Acids Res. 2021, doi: 10.1093/nar/gkab944 | Contact: Lukasz P. Kozlowski |
