Roseovarius tolerans
Taxonomy: cellular organisms; Bacteria; Proteobacteria; Alphaproteobacteria; Rhodobacterales; Roseobacteraceae; Roseovarius
Average proteome isoelectric point is 6.21
Get precalculated fractions of proteins

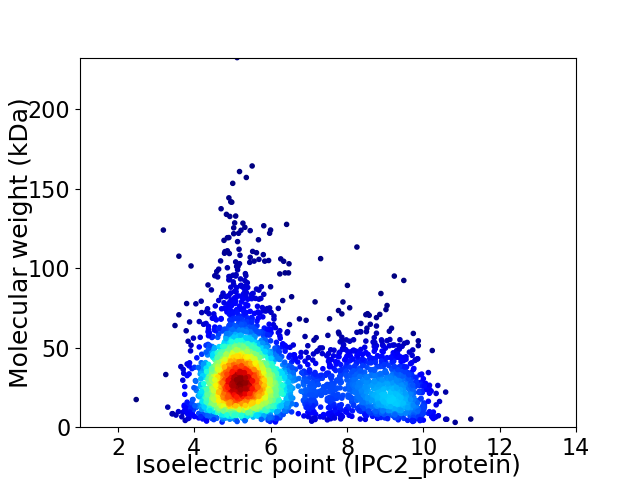
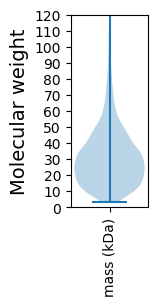
Virtual 2D-PAGE plot for 3684 proteins (isoelectric point calculated using IPC2_protein)
Get csv file with sequences according to given criteria:
* You can choose from 21 different methods for calculating isoelectric point
Summary statistics related to proteome-wise predictions


Protein with the lowest isoelectric point:
>tr|A0A0L6CX27|A0A0L6CX27_9RHOB GXGXG motif protein OS=Roseovarius tolerans OX=74031 GN=ROTO_12610 PE=4 SV=1
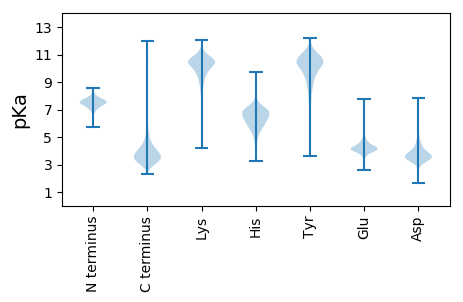
MM1 pKa = 7.59LKK3 pKa = 7.81TTTALATVTAIFAAPAFAGNVTEE26 pKa = 4.61PAPEE30 pKa = 3.9PVIEE34 pKa = 4.75APAPVPAAPLSPNWTGFYY52 pKa = 10.76GGGQLGWANVDD63 pKa = 3.14ADD65 pKa = 4.75GFDD68 pKa = 5.52DD69 pKa = 5.68DD70 pKa = 5.79DD71 pKa = 4.96SLIGGLTGGYY81 pKa = 10.36DD82 pKa = 3.51YY83 pKa = 11.35DD84 pKa = 3.92FQNGFVVGAGLDD96 pKa = 3.82YY97 pKa = 11.48DD98 pKa = 5.31FLDD101 pKa = 4.14ADD103 pKa = 3.77IGNVATAEE111 pKa = 4.07EE112 pKa = 4.49VFRR115 pKa = 11.84AKK117 pKa = 10.65LRR119 pKa = 11.84GGYY122 pKa = 10.07KK123 pKa = 9.52IGRR126 pKa = 11.84GLAYY130 pKa = 9.48ATGGYY135 pKa = 9.97AWADD139 pKa = 3.46TDD141 pKa = 5.24NLGDD145 pKa = 3.98DD146 pKa = 3.98DD147 pKa = 5.83GYY149 pKa = 11.5FVGAGYY155 pKa = 10.5EE156 pKa = 4.16HH157 pKa = 7.12MVTEE161 pKa = 4.42QVSLGGEE168 pKa = 4.09VLYY171 pKa = 11.13HH172 pKa = 6.13EE173 pKa = 5.63FEE175 pKa = 4.95DD176 pKa = 5.02FNGSGSDD183 pKa = 3.72VEE185 pKa = 4.4ATTVQARR192 pKa = 11.84ATFRR196 pKa = 11.84FF197 pKa = 3.77
MM1 pKa = 7.59LKK3 pKa = 7.81TTTALATVTAIFAAPAFAGNVTEE26 pKa = 4.61PAPEE30 pKa = 3.9PVIEE34 pKa = 4.75APAPVPAAPLSPNWTGFYY52 pKa = 10.76GGGQLGWANVDD63 pKa = 3.14ADD65 pKa = 4.75GFDD68 pKa = 5.52DD69 pKa = 5.68DD70 pKa = 5.79DD71 pKa = 4.96SLIGGLTGGYY81 pKa = 10.36DD82 pKa = 3.51YY83 pKa = 11.35DD84 pKa = 3.92FQNGFVVGAGLDD96 pKa = 3.82YY97 pKa = 11.48DD98 pKa = 5.31FLDD101 pKa = 4.14ADD103 pKa = 3.77IGNVATAEE111 pKa = 4.07EE112 pKa = 4.49VFRR115 pKa = 11.84AKK117 pKa = 10.65LRR119 pKa = 11.84GGYY122 pKa = 10.07KK123 pKa = 9.52IGRR126 pKa = 11.84GLAYY130 pKa = 9.48ATGGYY135 pKa = 9.97AWADD139 pKa = 3.46TDD141 pKa = 5.24NLGDD145 pKa = 3.98DD146 pKa = 3.98DD147 pKa = 5.83GYY149 pKa = 11.5FVGAGYY155 pKa = 10.5EE156 pKa = 4.16HH157 pKa = 7.12MVTEE161 pKa = 4.42QVSLGGEE168 pKa = 4.09VLYY171 pKa = 11.13HH172 pKa = 6.13EE173 pKa = 5.63FEE175 pKa = 4.95DD176 pKa = 5.02FNGSGSDD183 pKa = 3.72VEE185 pKa = 4.4ATTVQARR192 pKa = 11.84ATFRR196 pKa = 11.84FF197 pKa = 3.77
Molecular weight: 20.67 kDa
Isoelectric point according different methods:
Protein with the highest isoelectric point:
>tr|A0A0L6CY74|A0A0L6CY74_9RHOB DUF1330 domain-containing protein OS=Roseovarius tolerans OX=74031 GN=ROTO_09320 PE=4 SV=1
MM1 pKa = 7.45KK2 pKa = 9.61RR3 pKa = 11.84TFQPSNLVRR12 pKa = 11.84KK13 pKa = 9.18RR14 pKa = 11.84RR15 pKa = 11.84HH16 pKa = 4.42GFRR19 pKa = 11.84ARR21 pKa = 11.84MATKK25 pKa = 10.37AGRR28 pKa = 11.84KK29 pKa = 8.54ILNARR34 pKa = 11.84RR35 pKa = 11.84ARR37 pKa = 11.84GRR39 pKa = 11.84KK40 pKa = 9.07SLSAA44 pKa = 3.93
MM1 pKa = 7.45KK2 pKa = 9.61RR3 pKa = 11.84TFQPSNLVRR12 pKa = 11.84KK13 pKa = 9.18RR14 pKa = 11.84RR15 pKa = 11.84HH16 pKa = 4.42GFRR19 pKa = 11.84ARR21 pKa = 11.84MATKK25 pKa = 10.37AGRR28 pKa = 11.84KK29 pKa = 8.54ILNARR34 pKa = 11.84RR35 pKa = 11.84ARR37 pKa = 11.84GRR39 pKa = 11.84KK40 pKa = 9.07SLSAA44 pKa = 3.93
Molecular weight: 5.14 kDa
Isoelectric point according different methods:
Peptides (in silico digests for buttom-up proteomics)
Below you can find in silico digests of the whole proteome with Trypsin, Chymotrypsin, Trypsin+LysC, LysN, ArgC proteases suitable for different mass spec machines.| Try ESI |
 |
|---|
| ChTry ESI |
 |
|---|
| ArgC ESI |
 |
|---|
| LysN ESI |
 |
|---|
| TryLysC ESI |
 |
|---|
| Try MALDI |
 |
|---|
| ChTry MALDI |
 |
|---|
| ArgC MALDI |
 |
|---|
| LysN MALDI |
 |
|---|
| TryLysC MALDI |
 |
|---|
| Try LTQ |
 |
|---|
| ChTry LTQ |
 |
|---|
| ArgC LTQ |
 |
|---|
| LysN LTQ |
 |
|---|
| TryLysC LTQ |
 |
|---|
| Try MSlow |
 |
|---|
| ChTry MSlow |
 |
|---|
| ArgC MSlow |
 |
|---|
| LysN MSlow |
 |
|---|
| TryLysC MSlow |
 |
|---|
| Try MShigh |
 |
|---|
| ChTry MShigh |
 |
|---|
| ArgC MShigh |
 |
|---|
| LysN MShigh |
 |
|---|
| TryLysC MShigh |
 |
|---|
General Statistics
Number of major isoforms |
Number of additional isoforms |
Number of all proteins |
Number of amino acids |
Min. Seq. Length |
Max. Seq. Length |
Avg. Seq. Length |
Avg. Mol. Weight |
|---|---|---|---|---|---|---|---|
0 |
1107601 |
29 |
2135 |
300.7 |
32.67 |
Amino acid frequency
Ala |
Cys |
Asp |
Glu |
Phe |
Gly |
His |
Ile |
Lys |
Leu |
|---|---|---|---|---|---|---|---|---|---|
12.446 ± 0.057 | 0.934 ± 0.012 |
6.074 ± 0.039 | 5.971 ± 0.043 |
3.566 ± 0.028 | 8.817 ± 0.041 |
2.178 ± 0.019 | 5.034 ± 0.027 |
2.889 ± 0.031 | 10.166 ± 0.053 |
Met |
Asn |
Gln |
Pro |
Arg |
Ser |
Thr |
Val |
Trp |
Tyr |
|---|---|---|---|---|---|---|---|---|---|
2.867 ± 0.021 | 2.401 ± 0.023 |
5.154 ± 0.029 | 3.16 ± 0.019 |
7.14 ± 0.044 | 4.855 ± 0.023 |
5.469 ± 0.032 | 7.226 ± 0.039 |
1.446 ± 0.017 | 2.208 ± 0.022 |
Most of the basic statistics you can see at this page can be downloaded from this CSV file
Proteome-pI is available under Creative Commons Attribution-NoDerivs license, for more details see here
| Reference: Kozlowski LP. Proteome-pI 2.0: Proteome Isoelectric Point Database Update. Nucleic Acids Res. 2021, doi: 10.1093/nar/gkab944 | Contact: Lukasz P. Kozlowski |
