Intoshia linei
Taxonomy: cellular organisms; Eukaryota; Opisthokonta; Metazoa; Eumetazoa; Bilateria; Protostomia; Spiralia; Lophotrochozoa; Mesozoa; Orthonectida; Rhopaluridae; Intoshia
Average proteome isoelectric point is 7.27
Get precalculated fractions of proteins

Virtual 2D-PAGE plot for 8720 proteins (isoelectric point calculated using IPC2_protein)
Get csv file with sequences according to given criteria:
* You can choose from 21 different methods for calculating isoelectric point
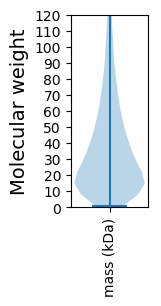
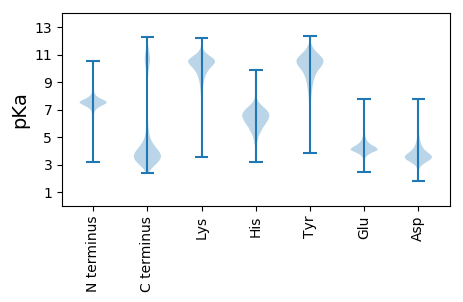
Summary statistics related to proteome-wise predictions


Protein with the lowest isoelectric point:
>tr|A0A177AUG4|A0A177AUG4_9BILA Uncharacterized protein OS=Intoshia linei OX=1819745 GN=A3Q56_06684 PE=4 SV=1
MM1 pKa = 7.79VEE3 pKa = 4.16LLVNEE8 pKa = 4.62LSDD11 pKa = 4.57NEE13 pKa = 4.45LDD15 pKa = 3.6NASTVRR21 pKa = 11.84YY22 pKa = 9.36QEE24 pKa = 3.89NSVCIYY30 pKa = 10.8EE31 pKa = 4.22NDD33 pKa = 3.55SLLGIGTLLIYY44 pKa = 10.79DD45 pKa = 4.22NFCRR49 pKa = 11.84WRR51 pKa = 11.84SSKK54 pKa = 9.54TDD56 pKa = 3.17QIMDD60 pKa = 3.68INYY63 pKa = 10.1EE64 pKa = 4.39DD65 pKa = 3.85IGVHH69 pKa = 6.68AICRR73 pKa = 11.84DD74 pKa = 3.29KK75 pKa = 11.31TRR77 pKa = 11.84FPQNCIYY84 pKa = 11.12LMVDD88 pKa = 3.29KK89 pKa = 10.63FVEE92 pKa = 4.36YY93 pKa = 10.32EE94 pKa = 3.78NSEE97 pKa = 4.17NVPTDD102 pKa = 3.01IYY104 pKa = 11.42NEE106 pKa = 3.83IRR108 pKa = 11.84FVPQNEE114 pKa = 3.82ASIDD118 pKa = 3.87TIFNTMIQFVVSSEE132 pKa = 3.84SDD134 pKa = 3.22IEE136 pKa = 4.51NKK138 pKa = 10.23FSDD141 pKa = 4.4YY142 pKa = 11.11EE143 pKa = 4.46DD144 pKa = 3.89NGCQFDD150 pKa = 3.99EE151 pKa = 5.18ADD153 pKa = 4.12EE154 pKa = 4.29EE155 pKa = 4.83TNSDD159 pKa = 3.03GDD161 pKa = 3.59
MM1 pKa = 7.79VEE3 pKa = 4.16LLVNEE8 pKa = 4.62LSDD11 pKa = 4.57NEE13 pKa = 4.45LDD15 pKa = 3.6NASTVRR21 pKa = 11.84YY22 pKa = 9.36QEE24 pKa = 3.89NSVCIYY30 pKa = 10.8EE31 pKa = 4.22NDD33 pKa = 3.55SLLGIGTLLIYY44 pKa = 10.79DD45 pKa = 4.22NFCRR49 pKa = 11.84WRR51 pKa = 11.84SSKK54 pKa = 9.54TDD56 pKa = 3.17QIMDD60 pKa = 3.68INYY63 pKa = 10.1EE64 pKa = 4.39DD65 pKa = 3.85IGVHH69 pKa = 6.68AICRR73 pKa = 11.84DD74 pKa = 3.29KK75 pKa = 11.31TRR77 pKa = 11.84FPQNCIYY84 pKa = 11.12LMVDD88 pKa = 3.29KK89 pKa = 10.63FVEE92 pKa = 4.36YY93 pKa = 10.32EE94 pKa = 3.78NSEE97 pKa = 4.17NVPTDD102 pKa = 3.01IYY104 pKa = 11.42NEE106 pKa = 3.83IRR108 pKa = 11.84FVPQNEE114 pKa = 3.82ASIDD118 pKa = 3.87TIFNTMIQFVVSSEE132 pKa = 3.84SDD134 pKa = 3.22IEE136 pKa = 4.51NKK138 pKa = 10.23FSDD141 pKa = 4.4YY142 pKa = 11.11EE143 pKa = 4.46DD144 pKa = 3.89NGCQFDD150 pKa = 3.99EE151 pKa = 5.18ADD153 pKa = 4.12EE154 pKa = 4.29EE155 pKa = 4.83TNSDD159 pKa = 3.03GDD161 pKa = 3.59
Molecular weight: 18.67 kDa
Isoelectric point according different methods:
Protein with the highest isoelectric point:
>tr|A0A177AZ59|A0A177AZ59_9BILA ADF-H domain-containing protein OS=Intoshia linei OX=1819745 GN=A3Q56_05122 PE=3 SV=1
MM1 pKa = 5.43VTKK4 pKa = 10.51RR5 pKa = 11.84KK6 pKa = 9.72VGRR9 pKa = 11.84KK10 pKa = 5.25ATKK13 pKa = 8.74PKK15 pKa = 9.99VVKK18 pKa = 10.28KK19 pKa = 9.21VAVRR23 pKa = 11.84KK24 pKa = 6.56TVKK27 pKa = 10.34RR28 pKa = 11.84SAKK31 pKa = 9.57PKK33 pKa = 9.14RR34 pKa = 11.84KK35 pKa = 9.05VVKK38 pKa = 10.58KK39 pKa = 10.05IVKK42 pKa = 9.27KK43 pKa = 9.88VNRR46 pKa = 11.84ASAKK50 pKa = 9.57GKK52 pKa = 9.92KK53 pKa = 9.14SKK55 pKa = 10.51KK56 pKa = 9.92
MM1 pKa = 5.43VTKK4 pKa = 10.51RR5 pKa = 11.84KK6 pKa = 9.72VGRR9 pKa = 11.84KK10 pKa = 5.25ATKK13 pKa = 8.74PKK15 pKa = 9.99VVKK18 pKa = 10.28KK19 pKa = 9.21VAVRR23 pKa = 11.84KK24 pKa = 6.56TVKK27 pKa = 10.34RR28 pKa = 11.84SAKK31 pKa = 9.57PKK33 pKa = 9.14RR34 pKa = 11.84KK35 pKa = 9.05VVKK38 pKa = 10.58KK39 pKa = 10.05IVKK42 pKa = 9.27KK43 pKa = 9.88VNRR46 pKa = 11.84ASAKK50 pKa = 9.57GKK52 pKa = 9.92KK53 pKa = 9.14SKK55 pKa = 10.51KK56 pKa = 9.92
Molecular weight: 6.32 kDa
Isoelectric point according different methods:
Peptides (in silico digests for buttom-up proteomics)
Below you can find in silico digests of the whole proteome with Trypsin, Chymotrypsin, Trypsin+LysC, LysN, ArgC proteases suitable for different mass spec machines.| Try ESI |
 |
|---|
| ChTry ESI |
 |
|---|
| ArgC ESI |
 |
|---|
| LysN ESI |
 |
|---|
| TryLysC ESI |
 |
|---|
| Try MALDI |
 |
|---|
| ChTry MALDI |
 |
|---|
| ArgC MALDI |
 |
|---|
| LysN MALDI |
 |
|---|
| TryLysC MALDI |
 |
|---|
| Try LTQ |
 |
|---|
| ChTry LTQ |
 |
|---|
| ArgC LTQ |
 |
|---|
| LysN LTQ |
 |
|---|
| TryLysC LTQ |
 |
|---|
| Try MSlow |
 |
|---|
| ChTry MSlow |
 |
|---|
| ArgC MSlow |
 |
|---|
| LysN MSlow |
 |
|---|
| TryLysC MSlow |
 |
|---|
| Try MShigh |
 |
|---|
| ChTry MShigh |
 |
|---|
| ArgC MShigh |
 |
|---|
| LysN MShigh |
 |
|---|
| TryLysC MShigh |
 |
|---|
General Statistics
Number of major isoforms |
Number of additional isoforms |
Number of all proteins |
Number of amino acids |
Min. Seq. Length |
Max. Seq. Length |
Avg. Seq. Length |
Avg. Mol. Weight |
|---|---|---|---|---|---|---|---|
0 |
3312867 |
9 |
6337 |
379.9 |
43.96 |
Amino acid frequency
Ala |
Cys |
Asp |
Glu |
Phe |
Gly |
His |
Ile |
Lys |
Leu |
|---|---|---|---|---|---|---|---|---|---|
3.439 ± 0.018 | 2.32 ± 0.029 |
5.561 ± 0.017 | 6.023 ± 0.027 |
4.924 ± 0.021 | 3.562 ± 0.033 |
2.183 ± 0.012 | 9.147 ± 0.026 |
9.308 ± 0.032 | 8.853 ± 0.026 |
Met |
Asn |
Gln |
Pro |
Arg |
Ser |
Thr |
Val |
Trp |
Tyr |
|---|---|---|---|---|---|---|---|---|---|
2.457 ± 0.011 | 8.442 ± 0.033 |
3.031 ± 0.019 | 3.445 ± 0.016 |
3.633 ± 0.02 | 8.007 ± 0.021 |
5.27 ± 0.023 | 5.104 ± 0.017 |
0.831 ± 0.007 | 4.459 ± 0.017 |
Most of the basic statistics you can see at this page can be downloaded from this CSV file
Proteome-pI is available under Creative Commons Attribution-NoDerivs license, for more details see here
| Reference: Kozlowski LP. Proteome-pI 2.0: Proteome Isoelectric Point Database Update. Nucleic Acids Res. 2021, doi: 10.1093/nar/gkab944 | Contact: Lukasz P. Kozlowski |
