Thermoplasmatales archaeon E-plasma
Taxonomy: cellular organisms; Archaea; Candidatus Thermoplasmatota; Thermoplasmata; Thermoplasmatales; unclassified Thermoplasmatales
Average proteome isoelectric point is 6.8
Get precalculated fractions of proteins
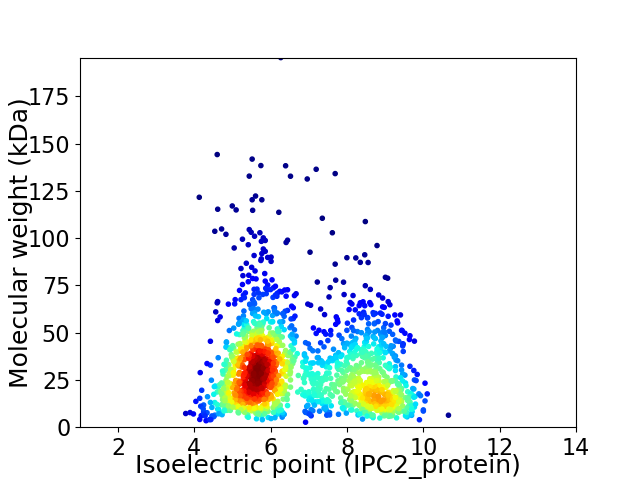
Virtual 2D-PAGE plot for 1661 proteins (isoelectric point calculated using IPC2_protein)
Get csv file with sequences according to given criteria:
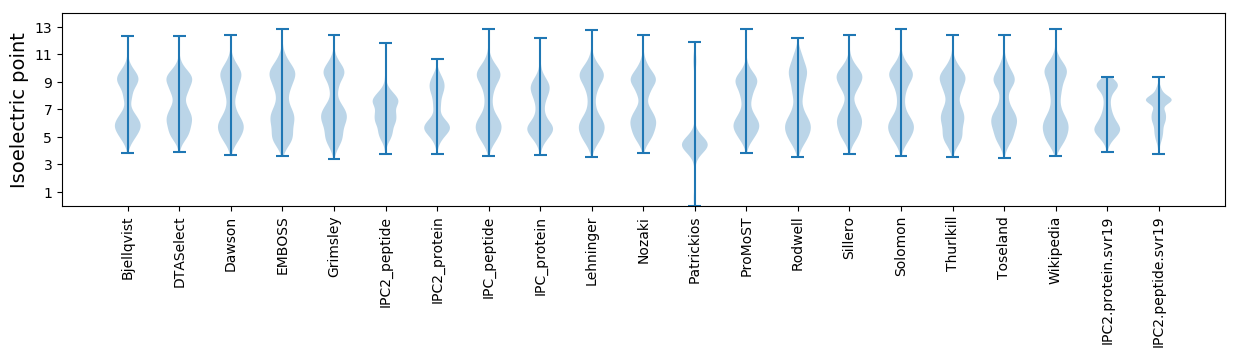
* You can choose from 21 different methods for calculating isoelectric point
Summary statistics related to proteome-wise predictions
Protein with the lowest isoelectric point:
>tr|T0MR89|T0MR89_9ARCH Proline--tRNA ligase OS=Thermoplasmatales archaeon E-plasma OX=667137 GN=proS PE=3 SV=1
MM1 pKa = 7.36AKK3 pKa = 10.04EE4 pKa = 3.88YY5 pKa = 9.6TPYY8 pKa = 10.1MVIEE12 pKa = 4.79AFPTNPICFHH22 pKa = 6.1SLEE25 pKa = 4.22NVLYY29 pKa = 10.74NDD31 pKa = 3.84VNGMDD36 pKa = 3.58IDD38 pKa = 4.04QDD40 pKa = 4.03VLLKK44 pKa = 10.83DD45 pKa = 3.56PEE47 pKa = 4.3YY48 pKa = 10.43MVMSEE53 pKa = 4.22ALLFGMKK60 pKa = 10.1VLIAEE65 pKa = 4.69RR66 pKa = 11.84FLATLL71 pKa = 4.09
MM1 pKa = 7.36AKK3 pKa = 10.04EE4 pKa = 3.88YY5 pKa = 9.6TPYY8 pKa = 10.1MVIEE12 pKa = 4.79AFPTNPICFHH22 pKa = 6.1SLEE25 pKa = 4.22NVLYY29 pKa = 10.74NDD31 pKa = 3.84VNGMDD36 pKa = 3.58IDD38 pKa = 4.04QDD40 pKa = 4.03VLLKK44 pKa = 10.83DD45 pKa = 3.56PEE47 pKa = 4.3YY48 pKa = 10.43MVMSEE53 pKa = 4.22ALLFGMKK60 pKa = 10.1VLIAEE65 pKa = 4.69RR66 pKa = 11.84FLATLL71 pKa = 4.09
Molecular weight: 8.16 kDa
Isoelectric point according different methods:
Protein with the highest isoelectric point:
>tr|T0MP68|T0MP68_9ARCH Uncharacterized protein OS=Thermoplasmatales archaeon E-plasma OX=667137 GN=AMDU2_EPLC00013G0003 PE=4 SV=1
MM1 pKa = 7.28TSSPSFRR8 pKa = 11.84RR9 pKa = 11.84EE10 pKa = 3.73LPTSKK15 pKa = 10.46VAGGISMGLNSPRR28 pKa = 11.84PEE30 pKa = 4.29GNLSFMLSHH39 pKa = 6.73LTLRR43 pKa = 11.84MQARR47 pKa = 11.84MKK49 pKa = 10.41QYY51 pKa = 10.81AIRR54 pKa = 11.84PLSLLSASGQINILRR69 pKa = 11.84EE70 pKa = 4.07IITFSLAFIPYY81 pKa = 8.59LAKK84 pKa = 11.01GEE86 pKa = 4.14FPLANVKK93 pKa = 10.11LCSLRR98 pKa = 11.84VSSLFKK104 pKa = 11.04DD105 pKa = 3.14RR106 pKa = 11.84VTEE109 pKa = 4.0LRR111 pKa = 11.84TCGASIGVYY120 pKa = 10.09VFLRR124 pKa = 11.84SNFCFSFMFFPMFLKK139 pKa = 10.57PPNQLLRR146 pKa = 11.84CPSRR150 pKa = 11.84NKK152 pKa = 9.06PTTEE156 pKa = 4.07VVGSS160 pKa = 3.71
MM1 pKa = 7.28TSSPSFRR8 pKa = 11.84RR9 pKa = 11.84EE10 pKa = 3.73LPTSKK15 pKa = 10.46VAGGISMGLNSPRR28 pKa = 11.84PEE30 pKa = 4.29GNLSFMLSHH39 pKa = 6.73LTLRR43 pKa = 11.84MQARR47 pKa = 11.84MKK49 pKa = 10.41QYY51 pKa = 10.81AIRR54 pKa = 11.84PLSLLSASGQINILRR69 pKa = 11.84EE70 pKa = 4.07IITFSLAFIPYY81 pKa = 8.59LAKK84 pKa = 11.01GEE86 pKa = 4.14FPLANVKK93 pKa = 10.11LCSLRR98 pKa = 11.84VSSLFKK104 pKa = 11.04DD105 pKa = 3.14RR106 pKa = 11.84VTEE109 pKa = 4.0LRR111 pKa = 11.84TCGASIGVYY120 pKa = 10.09VFLRR124 pKa = 11.84SNFCFSFMFFPMFLKK139 pKa = 10.57PPNQLLRR146 pKa = 11.84CPSRR150 pKa = 11.84NKK152 pKa = 9.06PTTEE156 pKa = 4.07VVGSS160 pKa = 3.71
Molecular weight: 17.89 kDa
Isoelectric point according different methods:
Peptides (in silico digests for buttom-up proteomics)
Below you can find in silico digests of the whole proteome with Trypsin, Chymotrypsin, Trypsin+LysC, LysN, ArgC proteases suitable for different mass spec machines.| Try ESI |
 |
|---|
| ChTry ESI |
|
|---|
| ArgC ESI |
|
|---|
| LysN ESI |
|
|---|
| TryLysC ESI |
|
|---|
| Try MALDI |
|
|---|
| ChTry MALDI |
|
|---|
| ArgC MALDI |
|
|---|
| LysN MALDI |
|
|---|
| TryLysC MALDI |
|
|---|
| Try LTQ |
|
|---|
| ChTry LTQ |
|
|---|
| ArgC LTQ |
|
|---|
| LysN LTQ |
|
|---|
| TryLysC LTQ |
|
|---|
| Try MSlow |
|
|---|
| ChTry MSlow |
|
|---|
| ArgC MSlow |
|
|---|
| LysN MSlow |
|
|---|
| TryLysC MSlow |
|
|---|
| Try MShigh |
|
|---|
| ChTry MShigh |
|
|---|
| ArgC MShigh |
|
|---|
| LysN MShigh |
|
|---|
| TryLysC MShigh |
|
|---|
General Statistics
Number of major isoforms |
Number of additional isoforms |
Number of all proteins |
Number of amino acids |
Min. Seq. Length |
Max. Seq. Length |
Avg. Seq. Length |
Avg. Mol. Weight |
|---|---|---|---|---|---|---|---|
0 |
480563 |
24 |
1714 |
289.3 |
32.5 |
Amino acid frequency
Ala |
Cys |
Asp |
Glu |
Phe |
Gly |
His |
Ile |
Lys |
Leu |
|---|---|---|---|---|---|---|---|---|---|
5.673 ± 0.053 | 0.703 ± 0.019 |
4.881 ± 0.056 | 6.672 ± 0.071 |
4.959 ± 0.056 | 7.106 ± 0.053 |
1.531 ± 0.023 | 9.389 ± 0.055 |
6.922 ± 0.074 | 8.859 ± 0.068 |
Met |
Asn |
Gln |
Pro |
Arg |
Ser |
Thr |
Val |
Trp |
Tyr |
|---|---|---|---|---|---|---|---|---|---|
2.93 ± 0.025 | 5.325 ± 0.066 |
3.648 ± 0.037 | 2.425 ± 0.03 |
4.559 ± 0.055 | 8.238 ± 0.088 |
5.174 ± 0.056 | 6.155 ± 0.04 |
0.84 ± 0.017 | 4.011 ± 0.043 |
Most of the basic statistics you can see at this page can be downloaded from this CSV file
See this proteome in:

Proteome-pI is available under Creative Commons Attribution-NoDerivs license, for more details see here
| Reference: Kozlowski LP. Proteome-pI 2.0: Proteome Isoelectric Point Database Update. Nucleic Acids Res. 2021, doi: 10.1093/nar/gkab944 | Contact: Lukasz P. Kozlowski |