Sphingomonas sp. AX6
Taxonomy: cellular organisms; Bacteria; Proteobacteria; Alphaproteobacteria; Sphingomonadales; Sphingomonadaceae; Sphingomonas; unclassified Sphingomonas
Average proteome isoelectric point is 6.52
Get precalculated fractions of proteins
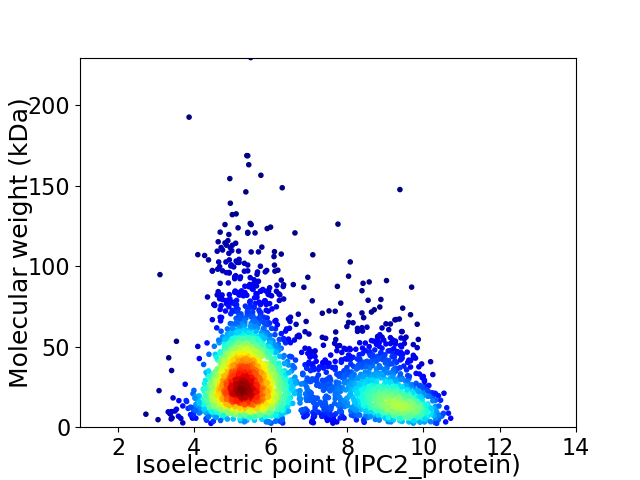
Virtual 2D-PAGE plot for 3153 proteins (isoelectric point calculated using IPC2_protein)
Get csv file with sequences according to given criteria:
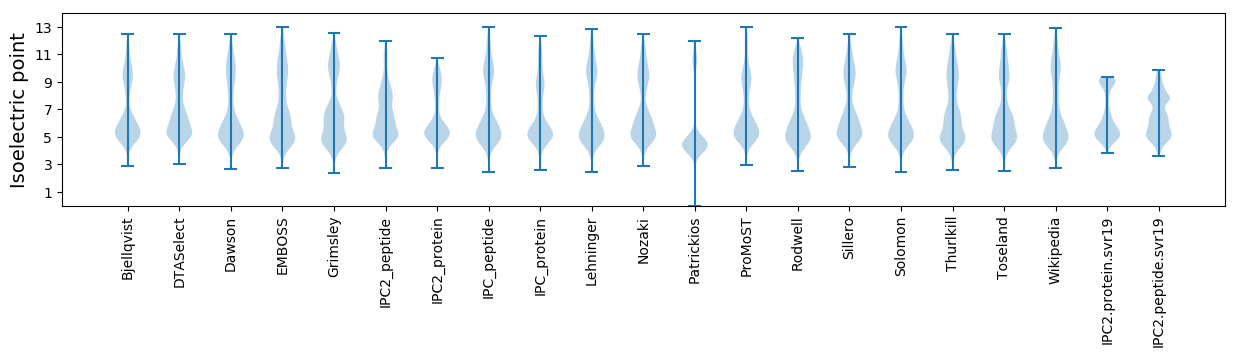
* You can choose from 21 different methods for calculating isoelectric point
Summary statistics related to proteome-wise predictions
Protein with the lowest isoelectric point:
>tr|A0A654A396|A0A654A396_9SPHN Sigma-fimbriae uncharacterized paralogous subunit OS=Sphingomonas sp. AX6 OX=2653171 GN=SPHINGOAX6_30121 PE=4 SV=1
MM1 pKa = 7.92RR2 pKa = 11.84FYY4 pKa = 10.75TPSLTALALAATATPAFAQDD24 pKa = 3.07TDD26 pKa = 3.66VPEE29 pKa = 4.38PVTVSSTITLTSDD42 pKa = 2.92YY43 pKa = 9.78RR44 pKa = 11.84FRR46 pKa = 11.84GITQSDD52 pKa = 3.91EE53 pKa = 4.14GPAAQAGIVVNHH65 pKa = 6.3EE66 pKa = 3.89SGFYY70 pKa = 9.5IGGWASSISNDD81 pKa = 3.25SLPGYY86 pKa = 10.61GEE88 pKa = 4.82AEE90 pKa = 4.08TNLFGGYY97 pKa = 7.54STEE100 pKa = 4.18TASGVGFDD108 pKa = 4.59VGLLYY113 pKa = 10.86YY114 pKa = 9.84LYY116 pKa = 10.01PDD118 pKa = 4.21AASGAQTDD126 pKa = 4.0FFEE129 pKa = 5.31PYY131 pKa = 10.53AAITYY136 pKa = 10.04SIGPVSTKK144 pKa = 10.58VGAAYY149 pKa = 10.03AWGGQDD155 pKa = 4.44GLDD158 pKa = 3.58FTGGKK163 pKa = 9.84DD164 pKa = 3.7DD165 pKa = 4.51NLYY168 pKa = 10.79LYY170 pKa = 10.82GDD172 pKa = 4.01ASVGIPTTPFSLNAHH187 pKa = 5.92VGRR190 pKa = 11.84SEE192 pKa = 4.46GSLALLNIDD201 pKa = 4.16SSDD204 pKa = 4.36VYY206 pKa = 10.23WDD208 pKa = 3.39WSAGVEE214 pKa = 4.15WSGGPIVGGLKK225 pKa = 10.8YY226 pKa = 10.2IDD228 pKa = 3.84TDD230 pKa = 3.16ISNDD234 pKa = 3.46GEE236 pKa = 4.34FAQSLGRR243 pKa = 11.84GSTVIGYY250 pKa = 9.94VGFSFF255 pKa = 5.06
MM1 pKa = 7.92RR2 pKa = 11.84FYY4 pKa = 10.75TPSLTALALAATATPAFAQDD24 pKa = 3.07TDD26 pKa = 3.66VPEE29 pKa = 4.38PVTVSSTITLTSDD42 pKa = 2.92YY43 pKa = 9.78RR44 pKa = 11.84FRR46 pKa = 11.84GITQSDD52 pKa = 3.91EE53 pKa = 4.14GPAAQAGIVVNHH65 pKa = 6.3EE66 pKa = 3.89SGFYY70 pKa = 9.5IGGWASSISNDD81 pKa = 3.25SLPGYY86 pKa = 10.61GEE88 pKa = 4.82AEE90 pKa = 4.08TNLFGGYY97 pKa = 7.54STEE100 pKa = 4.18TASGVGFDD108 pKa = 4.59VGLLYY113 pKa = 10.86YY114 pKa = 9.84LYY116 pKa = 10.01PDD118 pKa = 4.21AASGAQTDD126 pKa = 4.0FFEE129 pKa = 5.31PYY131 pKa = 10.53AAITYY136 pKa = 10.04SIGPVSTKK144 pKa = 10.58VGAAYY149 pKa = 10.03AWGGQDD155 pKa = 4.44GLDD158 pKa = 3.58FTGGKK163 pKa = 9.84DD164 pKa = 3.7DD165 pKa = 4.51NLYY168 pKa = 10.79LYY170 pKa = 10.82GDD172 pKa = 4.01ASVGIPTTPFSLNAHH187 pKa = 5.92VGRR190 pKa = 11.84SEE192 pKa = 4.46GSLALLNIDD201 pKa = 4.16SSDD204 pKa = 4.36VYY206 pKa = 10.23WDD208 pKa = 3.39WSAGVEE214 pKa = 4.15WSGGPIVGGLKK225 pKa = 10.8YY226 pKa = 10.2IDD228 pKa = 3.84TDD230 pKa = 3.16ISNDD234 pKa = 3.46GEE236 pKa = 4.34FAQSLGRR243 pKa = 11.84GSTVIGYY250 pKa = 9.94VGFSFF255 pKa = 5.06
Molecular weight: 26.67 kDa
Isoelectric point according different methods:
Protein with the highest isoelectric point:
>tr|A0A653YK69|A0A653YK69_9SPHN Uncharacterized protein OS=Sphingomonas sp. AX6 OX=2653171 GN=SPHINGOAX6_10102 PE=4 SV=1
MM1 pKa = 6.68QAARR5 pKa = 11.84SATRR9 pKa = 11.84RR10 pKa = 11.84GSGAGEE16 pKa = 4.19GAWDD20 pKa = 4.47GLSKK24 pKa = 10.91DD25 pKa = 3.77AGSAILPRR33 pKa = 11.84GCAAMADD40 pKa = 4.02EE41 pKa = 5.23NPARR45 pKa = 11.84MYY47 pKa = 10.9PFGNPDD53 pKa = 3.44GVKK56 pKa = 10.04HH57 pKa = 6.52LYY59 pKa = 10.11SLSRR63 pKa = 11.84CLPLTRR69 pKa = 11.84LSRR72 pKa = 11.84VAFEE76 pKa = 4.69LVEE79 pKa = 3.68KK80 pKa = 10.33AYY82 pKa = 10.36RR83 pKa = 11.84GRR85 pKa = 11.84GAITHH90 pKa = 6.23AVSIRR95 pKa = 11.84VLDD98 pKa = 4.28FARR101 pKa = 11.84TLLDD105 pKa = 3.3TNGFEE110 pKa = 4.63RR111 pKa = 11.84KK112 pKa = 9.22RR113 pKa = 11.84VVTRR117 pKa = 11.84PLRR120 pKa = 11.84PPHH123 pKa = 6.51AAPPALL129 pKa = 4.06
MM1 pKa = 6.68QAARR5 pKa = 11.84SATRR9 pKa = 11.84RR10 pKa = 11.84GSGAGEE16 pKa = 4.19GAWDD20 pKa = 4.47GLSKK24 pKa = 10.91DD25 pKa = 3.77AGSAILPRR33 pKa = 11.84GCAAMADD40 pKa = 4.02EE41 pKa = 5.23NPARR45 pKa = 11.84MYY47 pKa = 10.9PFGNPDD53 pKa = 3.44GVKK56 pKa = 10.04HH57 pKa = 6.52LYY59 pKa = 10.11SLSRR63 pKa = 11.84CLPLTRR69 pKa = 11.84LSRR72 pKa = 11.84VAFEE76 pKa = 4.69LVEE79 pKa = 3.68KK80 pKa = 10.33AYY82 pKa = 10.36RR83 pKa = 11.84GRR85 pKa = 11.84GAITHH90 pKa = 6.23AVSIRR95 pKa = 11.84VLDD98 pKa = 4.28FARR101 pKa = 11.84TLLDD105 pKa = 3.3TNGFEE110 pKa = 4.63RR111 pKa = 11.84KK112 pKa = 9.22RR113 pKa = 11.84VVTRR117 pKa = 11.84PLRR120 pKa = 11.84PPHH123 pKa = 6.51AAPPALL129 pKa = 4.06
Molecular weight: 13.93 kDa
Isoelectric point according different methods:
Peptides (in silico digests for buttom-up proteomics)
Below you can find in silico digests of the whole proteome with Trypsin, Chymotrypsin, Trypsin+LysC, LysN, ArgC proteases suitable for different mass spec machines.| Try ESI |
 |
|---|
| ChTry ESI |
|
|---|
| ArgC ESI |
|
|---|
| LysN ESI |
|
|---|
| TryLysC ESI |
|
|---|
| Try MALDI |
|
|---|
| ChTry MALDI |
|
|---|
| ArgC MALDI |
|
|---|
| LysN MALDI |
|
|---|
| TryLysC MALDI |
|
|---|
| Try LTQ |
|
|---|
| ChTry LTQ |
|
|---|
| ArgC LTQ |
|
|---|
| LysN LTQ |
|
|---|
| TryLysC LTQ |
|
|---|
| Try MSlow |
|
|---|
| ChTry MSlow |
|
|---|
| ArgC MSlow |
|
|---|
| LysN MSlow |
|
|---|
| TryLysC MSlow |
|
|---|
| Try MShigh |
|
|---|
| ChTry MShigh |
|
|---|
| ArgC MShigh |
|
|---|
| LysN MShigh |
|
|---|
| TryLysC MShigh |
|
|---|
General Statistics
Number of major isoforms |
Number of additional isoforms |
Number of all proteins |
Number of amino acids |
Min. Seq. Length |
Max. Seq. Length |
Avg. Seq. Length |
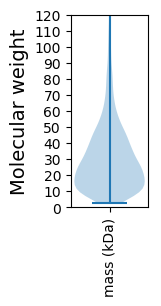
Avg. Mol. Weight |
|---|---|---|---|---|---|---|---|
0 |
934631 |
20 |
2132 |
296.4 |
31.99 |
Amino acid frequency
Ala |
Cys |
Asp |
Glu |
Phe |
Gly |
His |
Ile |
Lys |
Leu |
|---|---|---|---|---|---|---|---|---|---|
13.328 ± 0.066 | 0.743 ± 0.012 |
6.269 ± 0.035 | 5.367 ± 0.036 |
3.478 ± 0.029 | 9.002 ± 0.043 |
1.953 ± 0.023 | 5.123 ± 0.028 |
2.801 ± 0.037 | 9.476 ± 0.05 |
Met |
Asn |
Gln |
Pro |
Arg |
Ser |
Thr |
Val |
Trp |
Tyr |
|---|---|---|---|---|---|---|---|---|---|
2.496 ± 0.023 | 2.542 ± 0.026 |
5.309 ± 0.033 | 3.02 ± 0.025 |
7.614 ± 0.046 | 5.184 ± 0.03 |
5.429 ± 0.037 | 7.357 ± 0.037 |
1.428 ± 0.019 | 2.081 ± 0.023 |
Most of the basic statistics you can see at this page can be downloaded from this CSV file
See this proteome in:

Proteome-pI is available under Creative Commons Attribution-NoDerivs license, for more details see here
| Reference: Kozlowski LP. Proteome-pI 2.0: Proteome Isoelectric Point Database Update. Nucleic Acids Res. 2021, doi: 10.1093/nar/gkab944 | Contact: Lukasz P. Kozlowski |