Spirosoma radiotolerans
Taxonomy: cellular organisms; Bacteria; FCB group; Bacteroidetes/Chlorobi group; Bacteroidetes; Cytophagia; Cytophagales; Cytophagaceae; Spirosoma
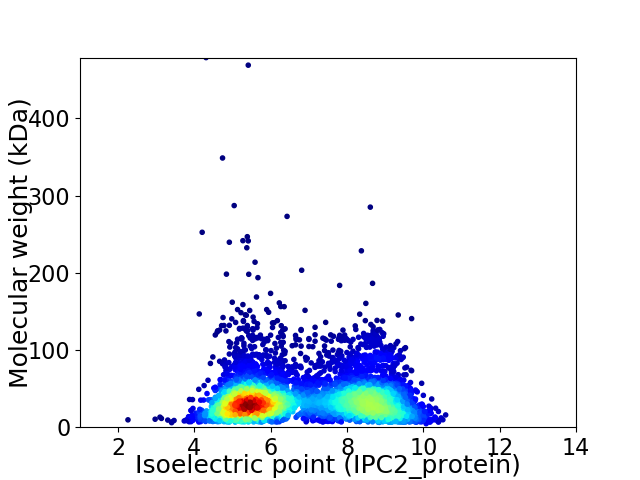
Average proteome isoelectric point is 6.81
Get precalculated fractions of proteins

Virtual 2D-PAGE plot for 5328 proteins (isoelectric point calculated using IPC2_protein)
Get csv file with sequences according to given criteria:
* You can choose from 21 different methods for calculating isoelectric point
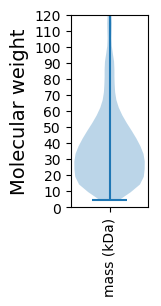
Summary statistics related to proteome-wise predictions


Protein with the lowest isoelectric point:
>tr|A0A0E3ZVJ5|A0A0E3ZVJ5_9BACT Ribokinase OS=Spirosoma radiotolerans OX=1379870 GN=SD10_15980 PE=4 SV=1
MM1 pKa = 7.67ANYY4 pKa = 10.34KK5 pKa = 10.34NDD7 pKa = 3.59GYY9 pKa = 11.27DD10 pKa = 3.34PEE12 pKa = 5.14EE13 pKa = 4.48ISALKK18 pKa = 10.42DD19 pKa = 3.06EE20 pKa = 5.35CSQEE24 pKa = 4.12GKK26 pKa = 10.51SFIYY30 pKa = 10.96VEE32 pKa = 5.48DD33 pKa = 3.83EE34 pKa = 4.18DD35 pKa = 6.46LDD37 pKa = 3.79VLEE40 pKa = 5.1EE41 pKa = 4.62GEE43 pKa = 4.34CRR45 pKa = 11.84HH46 pKa = 5.86IQFPGQYY53 pKa = 9.18QGQEE57 pKa = 4.23VIFDD61 pKa = 3.85TLVYY65 pKa = 9.37TLRR68 pKa = 11.84LHH70 pKa = 6.7HH71 pKa = 6.86SSLVYY76 pKa = 10.24EE77 pKa = 4.3MAVEE81 pKa = 4.6EE82 pKa = 4.29VQKK85 pKa = 9.56TFPTYY90 pKa = 10.57VPPEE94 pKa = 4.0EE95 pKa = 4.79RR96 pKa = 11.84KK97 pKa = 9.66PNYY100 pKa = 9.91KK101 pKa = 9.68IAPDD105 pKa = 3.77LEE107 pKa = 4.57EE108 pKa = 4.16EE109 pKa = 4.57AEE111 pKa = 4.23TALTEE116 pKa = 4.29IIEE119 pKa = 4.65EE120 pKa = 4.13IEE122 pKa = 3.85EE123 pKa = 4.43TEE125 pKa = 4.21TVKK128 pKa = 10.73VQEE131 pKa = 4.21HH132 pKa = 5.57VEE134 pKa = 3.89VDD136 pKa = 3.54LEE138 pKa = 4.16SDD140 pKa = 3.38YY141 pKa = 11.73GIALDD146 pKa = 3.41VCLNVDD152 pKa = 4.61EE153 pKa = 4.9ITDD156 pKa = 3.65EE157 pKa = 4.32VIEE160 pKa = 4.95DD161 pKa = 4.77FIAHH165 pKa = 6.44FKK167 pKa = 11.4ANTLSLDD174 pKa = 3.32TTLYY178 pKa = 10.74SFSSDD183 pKa = 3.44EE184 pKa = 4.39EE185 pKa = 3.96EE186 pKa = 4.67DD187 pKa = 3.44
MM1 pKa = 7.67ANYY4 pKa = 10.34KK5 pKa = 10.34NDD7 pKa = 3.59GYY9 pKa = 11.27DD10 pKa = 3.34PEE12 pKa = 5.14EE13 pKa = 4.48ISALKK18 pKa = 10.42DD19 pKa = 3.06EE20 pKa = 5.35CSQEE24 pKa = 4.12GKK26 pKa = 10.51SFIYY30 pKa = 10.96VEE32 pKa = 5.48DD33 pKa = 3.83EE34 pKa = 4.18DD35 pKa = 6.46LDD37 pKa = 3.79VLEE40 pKa = 5.1EE41 pKa = 4.62GEE43 pKa = 4.34CRR45 pKa = 11.84HH46 pKa = 5.86IQFPGQYY53 pKa = 9.18QGQEE57 pKa = 4.23VIFDD61 pKa = 3.85TLVYY65 pKa = 9.37TLRR68 pKa = 11.84LHH70 pKa = 6.7HH71 pKa = 6.86SSLVYY76 pKa = 10.24EE77 pKa = 4.3MAVEE81 pKa = 4.6EE82 pKa = 4.29VQKK85 pKa = 9.56TFPTYY90 pKa = 10.57VPPEE94 pKa = 4.0EE95 pKa = 4.79RR96 pKa = 11.84KK97 pKa = 9.66PNYY100 pKa = 9.91KK101 pKa = 9.68IAPDD105 pKa = 3.77LEE107 pKa = 4.57EE108 pKa = 4.16EE109 pKa = 4.57AEE111 pKa = 4.23TALTEE116 pKa = 4.29IIEE119 pKa = 4.65EE120 pKa = 4.13IEE122 pKa = 3.85EE123 pKa = 4.43TEE125 pKa = 4.21TVKK128 pKa = 10.73VQEE131 pKa = 4.21HH132 pKa = 5.57VEE134 pKa = 3.89VDD136 pKa = 3.54LEE138 pKa = 4.16SDD140 pKa = 3.38YY141 pKa = 11.73GIALDD146 pKa = 3.41VCLNVDD152 pKa = 4.61EE153 pKa = 4.9ITDD156 pKa = 3.65EE157 pKa = 4.32VIEE160 pKa = 4.95DD161 pKa = 4.77FIAHH165 pKa = 6.44FKK167 pKa = 11.4ANTLSLDD174 pKa = 3.32TTLYY178 pKa = 10.74SFSSDD183 pKa = 3.44EE184 pKa = 4.39EE185 pKa = 3.96EE186 pKa = 4.67DD187 pKa = 3.44
Molecular weight: 21.53 kDa
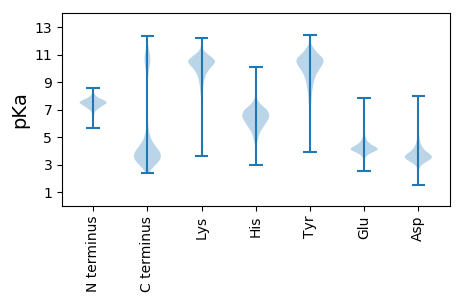
Isoelectric point according different methods:
Protein with the highest isoelectric point:
>tr|A0A0E3ZTF7|A0A0E3ZTF7_9BACT Esterase OS=Spirosoma radiotolerans OX=1379870 GN=SD10_01855 PE=4 SV=1
MM1 pKa = 7.24IRR3 pKa = 11.84HH4 pKa = 5.6VEE6 pKa = 4.09LGATPISRR14 pKa = 11.84LRR16 pKa = 11.84TLSALVGIGRR26 pKa = 11.84VSLGGNRR33 pKa = 11.84PGKK36 pKa = 10.22IYY38 pKa = 11.09GLLTCRR44 pKa = 11.84AGKK47 pKa = 10.04RR48 pKa = 11.84MNVANRR54 pKa = 11.84VFFSDD59 pKa = 3.24EE60 pKa = 3.96AEE62 pKa = 4.7AILAGFRR69 pKa = 11.84PCAVCLPAQYY79 pKa = 10.46KK80 pKa = 9.4AWQRR84 pKa = 11.84EE85 pKa = 3.97QQ86 pKa = 3.17
MM1 pKa = 7.24IRR3 pKa = 11.84HH4 pKa = 5.6VEE6 pKa = 4.09LGATPISRR14 pKa = 11.84LRR16 pKa = 11.84TLSALVGIGRR26 pKa = 11.84VSLGGNRR33 pKa = 11.84PGKK36 pKa = 10.22IYY38 pKa = 11.09GLLTCRR44 pKa = 11.84AGKK47 pKa = 10.04RR48 pKa = 11.84MNVANRR54 pKa = 11.84VFFSDD59 pKa = 3.24EE60 pKa = 3.96AEE62 pKa = 4.7AILAGFRR69 pKa = 11.84PCAVCLPAQYY79 pKa = 10.46KK80 pKa = 9.4AWQRR84 pKa = 11.84EE85 pKa = 3.97QQ86 pKa = 3.17
Molecular weight: 9.43 kDa
Isoelectric point according different methods:
Peptides (in silico digests for buttom-up proteomics)
Below you can find in silico digests of the whole proteome with Trypsin, Chymotrypsin, Trypsin+LysC, LysN, ArgC proteases suitable for different mass spec machines.| Try ESI |
 |
|---|
| ChTry ESI |
 |
|---|
| ArgC ESI |
 |
|---|
| LysN ESI |
 |
|---|
| TryLysC ESI |
 |
|---|
| Try MALDI |
 |
|---|
| ChTry MALDI |
 |
|---|
| ArgC MALDI |
 |
|---|
| LysN MALDI |
 |
|---|
| TryLysC MALDI |
 |
|---|
| Try LTQ |
 |
|---|
| ChTry LTQ |
 |
|---|
| ArgC LTQ |
 |
|---|
| LysN LTQ |
 |
|---|
| TryLysC LTQ |
 |
|---|
| Try MSlow |
 |
|---|
| ChTry MSlow |
 |
|---|
| ArgC MSlow |
 |
|---|
| LysN MSlow |
 |
|---|
| TryLysC MSlow |
 |
|---|
| Try MShigh |
 |
|---|
| ChTry MShigh |
 |
|---|
| ArgC MShigh |
 |
|---|
| LysN MShigh |
 |
|---|
| TryLysC MShigh |
 |
|---|
General Statistics
Number of major isoforms |
Number of additional isoforms |
Number of all proteins |
Number of amino acids |
Min. Seq. Length |
Max. Seq. Length |
Avg. Seq. Length |
Avg. Mol. Weight |
|---|---|---|---|---|---|---|---|
0 |
1911320 |
38 |
4907 |
358.7 |
39.89 |
Amino acid frequency
Ala |
Cys |
Asp |
Glu |
Phe |
Gly |
His |
Ile |
Lys |
Leu |
|---|---|---|---|---|---|---|---|---|---|
8.422 ± 0.032 | 0.725 ± 0.012 |
5.355 ± 0.024 | 5.075 ± 0.031 |
4.459 ± 0.027 | 7.207 ± 0.033 |
1.842 ± 0.015 | 5.876 ± 0.025 |
5.098 ± 0.033 | 10.057 ± 0.041 |
Met |
Asn |
Gln |
Pro |
Arg |
Ser |
Thr |
Val |
Trp |
Tyr |
|---|---|---|---|---|---|---|---|---|---|
2.15 ± 0.016 | 4.638 ± 0.029 |
4.651 ± 0.022 | 4.472 ± 0.022 |
5.153 ± 0.025 | 6.26 ± 0.034 |
6.55 ± 0.04 | 6.925 ± 0.031 |
1.285 ± 0.013 | 3.799 ± 0.022 |
Most of the basic statistics you can see at this page can be downloaded from this CSV file
Proteome-pI is available under Creative Commons Attribution-NoDerivs license, for more details see here
| Reference: Kozlowski LP. Proteome-pI 2.0: Proteome Isoelectric Point Database Update. Nucleic Acids Res. 2021, doi: 10.1093/nar/gkab944 | Contact: Lukasz P. Kozlowski |
