Rattus norvegicus polyomavirus 2
Taxonomy: Viruses; Monodnaviria; Shotokuvirae; Cossaviricota; Papovaviricetes; Sepolyvirales; Polyomaviridae; Betapolyomavirus
Average proteome isoelectric point is 7.52
Get precalculated fractions of proteins

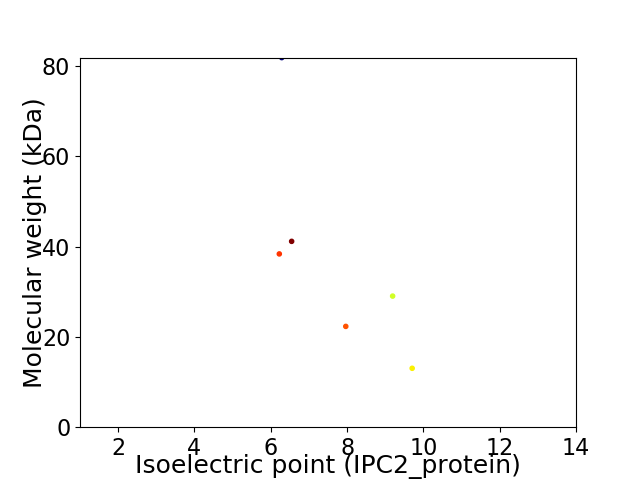
Virtual 2D-PAGE plot for 6 proteins (isoelectric point calculated using IPC2_protein)
Get csv file with sequences according to given criteria:
* You can choose from 21 different methods for calculating isoelectric point
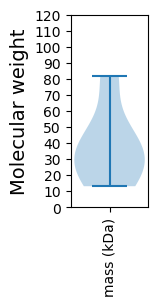
Summary statistics related to proteome-wise predictions


Protein with the lowest isoelectric point:
>tr|A0A1J0MVR9|A0A1J0MVR9_9POLY Large T antigen OS=Rattus norvegicus polyomavirus 2 OX=1919247 PE=4 SV=1
MM1 pKa = 7.65SRR3 pKa = 11.84VTCQRR8 pKa = 11.84KK9 pKa = 9.01RR10 pKa = 11.84LGPGRR15 pKa = 11.84APVQKK20 pKa = 10.32LPRR23 pKa = 11.84VIKK26 pKa = 10.36KK27 pKa = 10.66GGVEE31 pKa = 4.1VLATVPPGPEE41 pKa = 3.62SEE43 pKa = 4.67YY44 pKa = 10.71KK45 pKa = 10.79LEE47 pKa = 4.43MFLKK51 pKa = 10.24PCFGNDD57 pKa = 2.88SGQAGPHH64 pKa = 5.21YY65 pKa = 9.15WNHH68 pKa = 5.94SSPFTGEE75 pKa = 3.72ALTDD79 pKa = 3.47GDD81 pKa = 4.14YY82 pKa = 10.94HH83 pKa = 7.49VCYY86 pKa = 10.93SMGQIQLPEE95 pKa = 4.41ISDD98 pKa = 3.68QCSEE102 pKa = 4.09EE103 pKa = 4.37YY104 pKa = 9.77MVVWEE109 pKa = 4.7CYY111 pKa = 9.8RR112 pKa = 11.84MEE114 pKa = 4.28TEE116 pKa = 4.04VLYY119 pKa = 10.17TPKK122 pKa = 9.06ITAAGLSGSNFLAVQGTQMYY142 pKa = 8.12FWAVGGEE149 pKa = 4.19PLDD152 pKa = 3.74VMYY155 pKa = 9.59MLPKK159 pKa = 10.55EE160 pKa = 4.15KK161 pKa = 10.12MNPQGNLRR169 pKa = 11.84APSTTHH175 pKa = 6.35SVYY178 pKa = 10.72DD179 pKa = 3.72PNIIRR184 pKa = 11.84EE185 pKa = 4.2KK186 pKa = 10.53LSSEE190 pKa = 4.68LYY192 pKa = 9.43PVEE195 pKa = 4.22YY196 pKa = 7.27WTPDD200 pKa = 3.11PSRR203 pKa = 11.84NEE205 pKa = 3.43NTRR208 pKa = 11.84YY209 pKa = 9.31FGRR212 pKa = 11.84IVGGAATPPVVTYY225 pKa = 10.46SNSSTIPLLDD235 pKa = 3.7EE236 pKa = 4.58NGVGVLCNQQRR247 pKa = 11.84CYY249 pKa = 8.68VTCADD254 pKa = 3.16ITGFLHH260 pKa = 6.62NRR262 pKa = 11.84IEE264 pKa = 4.27TAHH267 pKa = 5.89GRR269 pKa = 11.84FFRR272 pKa = 11.84LHH274 pKa = 4.9FRR276 pKa = 11.84QRR278 pKa = 11.84RR279 pKa = 11.84VKK281 pKa = 10.65NPYY284 pKa = 9.26TMSLLYY290 pKa = 10.29KK291 pKa = 10.0QVLIQRR297 pKa = 11.84PPQVAAQLGVTEE309 pKa = 4.15VTIEE313 pKa = 4.03EE314 pKa = 4.49GQAPAPVMAQVGSCEE329 pKa = 4.44PMITQQASSMLNVQGG344 pKa = 4.06
MM1 pKa = 7.65SRR3 pKa = 11.84VTCQRR8 pKa = 11.84KK9 pKa = 9.01RR10 pKa = 11.84LGPGRR15 pKa = 11.84APVQKK20 pKa = 10.32LPRR23 pKa = 11.84VIKK26 pKa = 10.36KK27 pKa = 10.66GGVEE31 pKa = 4.1VLATVPPGPEE41 pKa = 3.62SEE43 pKa = 4.67YY44 pKa = 10.71KK45 pKa = 10.79LEE47 pKa = 4.43MFLKK51 pKa = 10.24PCFGNDD57 pKa = 2.88SGQAGPHH64 pKa = 5.21YY65 pKa = 9.15WNHH68 pKa = 5.94SSPFTGEE75 pKa = 3.72ALTDD79 pKa = 3.47GDD81 pKa = 4.14YY82 pKa = 10.94HH83 pKa = 7.49VCYY86 pKa = 10.93SMGQIQLPEE95 pKa = 4.41ISDD98 pKa = 3.68QCSEE102 pKa = 4.09EE103 pKa = 4.37YY104 pKa = 9.77MVVWEE109 pKa = 4.7CYY111 pKa = 9.8RR112 pKa = 11.84MEE114 pKa = 4.28TEE116 pKa = 4.04VLYY119 pKa = 10.17TPKK122 pKa = 9.06ITAAGLSGSNFLAVQGTQMYY142 pKa = 8.12FWAVGGEE149 pKa = 4.19PLDD152 pKa = 3.74VMYY155 pKa = 9.59MLPKK159 pKa = 10.55EE160 pKa = 4.15KK161 pKa = 10.12MNPQGNLRR169 pKa = 11.84APSTTHH175 pKa = 6.35SVYY178 pKa = 10.72DD179 pKa = 3.72PNIIRR184 pKa = 11.84EE185 pKa = 4.2KK186 pKa = 10.53LSSEE190 pKa = 4.68LYY192 pKa = 9.43PVEE195 pKa = 4.22YY196 pKa = 7.27WTPDD200 pKa = 3.11PSRR203 pKa = 11.84NEE205 pKa = 3.43NTRR208 pKa = 11.84YY209 pKa = 9.31FGRR212 pKa = 11.84IVGGAATPPVVTYY225 pKa = 10.46SNSSTIPLLDD235 pKa = 3.7EE236 pKa = 4.58NGVGVLCNQQRR247 pKa = 11.84CYY249 pKa = 8.68VTCADD254 pKa = 3.16ITGFLHH260 pKa = 6.62NRR262 pKa = 11.84IEE264 pKa = 4.27TAHH267 pKa = 5.89GRR269 pKa = 11.84FFRR272 pKa = 11.84LHH274 pKa = 4.9FRR276 pKa = 11.84QRR278 pKa = 11.84RR279 pKa = 11.84VKK281 pKa = 10.65NPYY284 pKa = 9.26TMSLLYY290 pKa = 10.29KK291 pKa = 10.0QVLIQRR297 pKa = 11.84PPQVAAQLGVTEE309 pKa = 4.15VTIEE313 pKa = 4.03EE314 pKa = 4.49GQAPAPVMAQVGSCEE329 pKa = 4.44PMITQQASSMLNVQGG344 pKa = 4.06
Molecular weight: 38.38 kDa
Isoelectric point according different methods:
Protein with the highest isoelectric point:
>tr|A0A1J0MVR8|A0A1J0MVR8_9POLY Major capsid protein VP1 OS=Rattus norvegicus polyomavirus 2 OX=1919247 PE=3 SV=1
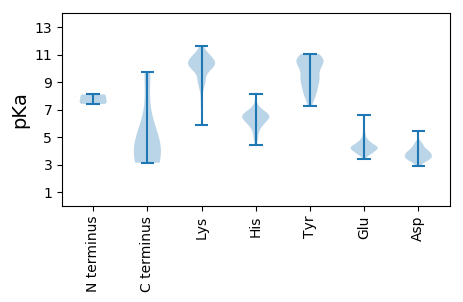
MM1 pKa = 7.41EE2 pKa = 6.0PEE4 pKa = 3.89NGICGGSNLTEE15 pKa = 4.01LGKK18 pKa = 10.29RR19 pKa = 11.84SKK21 pKa = 11.0SEE23 pKa = 3.64EE24 pKa = 3.93TGKK27 pKa = 10.52KK28 pKa = 9.04EE29 pKa = 4.35RR30 pKa = 11.84SGEE33 pKa = 3.98NNLIEE38 pKa = 4.38IVSKK42 pKa = 10.83VSKK45 pKa = 9.14TLPISPRR52 pKa = 11.84SRR54 pKa = 11.84GPVPKK59 pKa = 10.41GLLKK63 pKa = 10.94GPLKK67 pKa = 10.5ALRR70 pKa = 11.84VRR72 pKa = 11.84KK73 pKa = 7.8TFTVMRR79 pKa = 11.84NSLMSHH85 pKa = 6.43LRR87 pKa = 11.84RR88 pKa = 11.84NLLAIPKK95 pKa = 8.81QLPPKK100 pKa = 8.51RR101 pKa = 11.84IKK103 pKa = 10.3MIFLTFQNICWNLL116 pKa = 3.13
MM1 pKa = 7.41EE2 pKa = 6.0PEE4 pKa = 3.89NGICGGSNLTEE15 pKa = 4.01LGKK18 pKa = 10.29RR19 pKa = 11.84SKK21 pKa = 11.0SEE23 pKa = 3.64EE24 pKa = 3.93TGKK27 pKa = 10.52KK28 pKa = 9.04EE29 pKa = 4.35RR30 pKa = 11.84SGEE33 pKa = 3.98NNLIEE38 pKa = 4.38IVSKK42 pKa = 10.83VSKK45 pKa = 9.14TLPISPRR52 pKa = 11.84SRR54 pKa = 11.84GPVPKK59 pKa = 10.41GLLKK63 pKa = 10.94GPLKK67 pKa = 10.5ALRR70 pKa = 11.84VRR72 pKa = 11.84KK73 pKa = 7.8TFTVMRR79 pKa = 11.84NSLMSHH85 pKa = 6.43LRR87 pKa = 11.84RR88 pKa = 11.84NLLAIPKK95 pKa = 8.81QLPPKK100 pKa = 8.51RR101 pKa = 11.84IKK103 pKa = 10.3MIFLTFQNICWNLL116 pKa = 3.13
Molecular weight: 13.05 kDa
Isoelectric point according different methods:
Peptides (in silico digests for buttom-up proteomics)
Below you can find in silico digests of the whole proteome with Trypsin, Chymotrypsin, Trypsin+LysC, LysN, ArgC proteases suitable for different mass spec machines.| Try ESI |
 |
|---|
| ChTry ESI |
 |
|---|
| ArgC ESI |
 |
|---|
| LysN ESI |
 |
|---|
| TryLysC ESI |
 |
|---|
| Try MALDI |
 |
|---|
| ChTry MALDI |
 |
|---|
| ArgC MALDI |
 |
|---|
| LysN MALDI |
 |
|---|
| TryLysC MALDI |
 |
|---|
| Try LTQ |
 |
|---|
| ChTry LTQ |
 |
|---|
| ArgC LTQ |
 |
|---|
| LysN LTQ |
 |
|---|
| TryLysC LTQ |
 |
|---|
| Try MSlow |
 |
|---|
| ChTry MSlow |
 |
|---|
| ArgC MSlow |
 |
|---|
| LysN MSlow |
 |
|---|
| TryLysC MSlow |
 |
|---|
| Try MShigh |
 |
|---|
| ChTry MShigh |
 |
|---|
| ArgC MShigh |
 |
|---|
| LysN MShigh |
 |
|---|
| TryLysC MShigh |
 |
|---|
General Statistics
Number of major isoforms |
Number of additional isoforms |
Number of all proteins |
Number of amino acids |
Min. Seq. Length |
Max. Seq. Length |
Avg. Seq. Length |
Avg. Mol. Weight |
|---|---|---|---|---|---|---|---|
0 |
2004 |
116 |
701 |
334.0 |
37.64 |
Amino acid frequency
Ala |
Cys |
Asp |
Glu |
Phe |
Gly |
His |
Ile |
Lys |
Leu |
|---|---|---|---|---|---|---|---|---|---|
6.337 ± 1.507 | 2.495 ± 0.688 |
4.291 ± 0.775 | 6.836 ± 0.697 |
3.493 ± 0.836 | 7.036 ± 1.194 |
2.495 ± 0.362 | 4.691 ± 0.427 |
6.637 ± 1.437 | 9.182 ± 0.55 |
Met |
Asn |
Gln |
Pro |
Arg |
Ser |
Thr |
Val |
Trp |
Tyr |
|---|---|---|---|---|---|---|---|---|---|
2.545 ± 0.422 | 4.741 ± 0.361 |
5.639 ± 0.672 | 4.84 ± 0.652 |
5.988 ± 0.695 | 5.988 ± 0.684 |
5.589 ± 0.413 | 6.537 ± 0.645 |
1.397 ± 0.233 | 3.244 ± 0.543 |
Most of the basic statistics you can see at this page can be downloaded from this CSV file
Proteome-pI is available under Creative Commons Attribution-NoDerivs license, for more details see here
| Reference: Kozlowski LP. Proteome-pI 2.0: Proteome Isoelectric Point Database Update. Nucleic Acids Res. 2021, doi: 10.1093/nar/gkab944 | Contact: Lukasz P. Kozlowski |
