Bifidobacterium subtile
Taxonomy: cellular organisms; Bacteria; Terrabacteria group; Actinobacteria; Actinomycetia; Bifidobacteriales; Bifidobacteriaceae; Bifidobacterium
Average proteome isoelectric point is 6.3
Get precalculated fractions of proteins
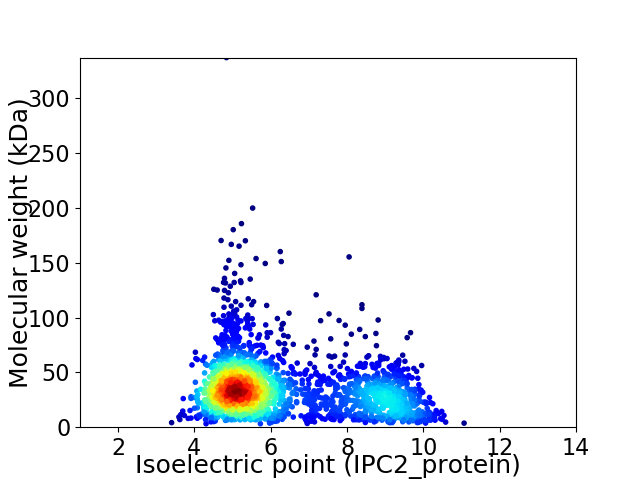
Virtual 2D-PAGE plot for 2259 proteins (isoelectric point calculated using IPC2_protein)
Get csv file with sequences according to given criteria:
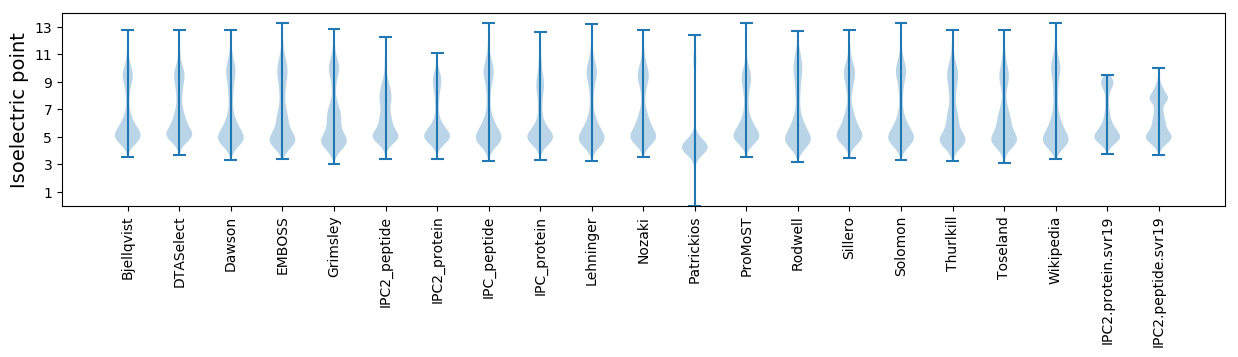
* You can choose from 21 different methods for calculating isoelectric point
Summary statistics related to proteome-wise predictions
Protein with the lowest isoelectric point:
>tr|A0A087E8H8|A0A087E8H8_9BIFI Peptide ABC transporter permease OS=Bifidobacterium subtile OX=77635 GN=BISU_1117 PE=3 SV=1
MM1 pKa = 7.13AQDD4 pKa = 3.51YY5 pKa = 10.08DD6 pKa = 3.82SPRR9 pKa = 11.84NKK11 pKa = 10.84DD12 pKa = 3.11EE13 pKa = 5.41DD14 pKa = 3.99EE15 pKa = 4.81EE16 pKa = 4.49SLQEE20 pKa = 4.51LGKK23 pKa = 10.91GSQNSSNEE31 pKa = 3.44IDD33 pKa = 3.9DD34 pKa = 4.83DD35 pKa = 4.4EE36 pKa = 4.41NAIAEE41 pKa = 4.35DD42 pKa = 4.23YY43 pKa = 9.11EE44 pKa = 5.05LPGADD49 pKa = 5.03LSNEE53 pKa = 4.1DD54 pKa = 3.77ASVTVIPMQGDD65 pKa = 3.56EE66 pKa = 5.01FVCSQCFLVRR76 pKa = 11.84HH77 pKa = 6.27RR78 pKa = 11.84SQLAYY83 pKa = 9.44MDD85 pKa = 4.69EE86 pKa = 4.89DD87 pKa = 3.8GQPVCKK93 pKa = 10.23EE94 pKa = 3.94CAAA97 pKa = 4.21
MM1 pKa = 7.13AQDD4 pKa = 3.51YY5 pKa = 10.08DD6 pKa = 3.82SPRR9 pKa = 11.84NKK11 pKa = 10.84DD12 pKa = 3.11EE13 pKa = 5.41DD14 pKa = 3.99EE15 pKa = 4.81EE16 pKa = 4.49SLQEE20 pKa = 4.51LGKK23 pKa = 10.91GSQNSSNEE31 pKa = 3.44IDD33 pKa = 3.9DD34 pKa = 4.83DD35 pKa = 4.4EE36 pKa = 4.41NAIAEE41 pKa = 4.35DD42 pKa = 4.23YY43 pKa = 9.11EE44 pKa = 5.05LPGADD49 pKa = 5.03LSNEE53 pKa = 4.1DD54 pKa = 3.77ASVTVIPMQGDD65 pKa = 3.56EE66 pKa = 5.01FVCSQCFLVRR76 pKa = 11.84HH77 pKa = 6.27RR78 pKa = 11.84SQLAYY83 pKa = 9.44MDD85 pKa = 4.69EE86 pKa = 4.89DD87 pKa = 3.8GQPVCKK93 pKa = 10.23EE94 pKa = 3.94CAAA97 pKa = 4.21
Molecular weight: 10.75 kDa
Isoelectric point according different methods:
Protein with the highest isoelectric point:
>tr|A0A087E3Z3|A0A087E3Z3_9BIFI DEAD/DEAH box helicase domain-containing protein OS=Bifidobacterium subtile OX=77635 GN=BISU_1694 PE=4 SV=1
MM1 pKa = 7.4GSVIKK6 pKa = 10.38KK7 pKa = 8.42RR8 pKa = 11.84RR9 pKa = 11.84KK10 pKa = 9.06RR11 pKa = 11.84MSKK14 pKa = 9.63KK15 pKa = 9.39KK16 pKa = 9.21HH17 pKa = 5.44RR18 pKa = 11.84KK19 pKa = 6.23MLRR22 pKa = 11.84KK23 pKa = 7.88TRR25 pKa = 11.84HH26 pKa = 3.78QRR28 pKa = 11.84KK29 pKa = 8.94
MM1 pKa = 7.4GSVIKK6 pKa = 10.38KK7 pKa = 8.42RR8 pKa = 11.84RR9 pKa = 11.84KK10 pKa = 9.06RR11 pKa = 11.84MSKK14 pKa = 9.63KK15 pKa = 9.39KK16 pKa = 9.21HH17 pKa = 5.44RR18 pKa = 11.84KK19 pKa = 6.23MLRR22 pKa = 11.84KK23 pKa = 7.88TRR25 pKa = 11.84HH26 pKa = 3.78QRR28 pKa = 11.84KK29 pKa = 8.94
Molecular weight: 3.72 kDa
Isoelectric point according different methods:
Peptides (in silico digests for buttom-up proteomics)
Below you can find in silico digests of the whole proteome with Trypsin, Chymotrypsin, Trypsin+LysC, LysN, ArgC proteases suitable for different mass spec machines.| Try ESI |
 |
|---|
| ChTry ESI |
|
|---|
| ArgC ESI |
|
|---|
| LysN ESI |
|
|---|
| TryLysC ESI |
|
|---|
| Try MALDI |
|
|---|
| ChTry MALDI |
|
|---|
| ArgC MALDI |
|
|---|
| LysN MALDI |
|
|---|
| TryLysC MALDI |
|
|---|
| Try LTQ |
|
|---|
| ChTry LTQ |
|
|---|
| ArgC LTQ |
|
|---|
| LysN LTQ |
|
|---|
| TryLysC LTQ |
|
|---|
| Try MSlow |
|
|---|
| ChTry MSlow |
|
|---|
| ArgC MSlow |
|
|---|
| LysN MSlow |
|
|---|
| TryLysC MSlow |
|
|---|
| Try MShigh |
|
|---|
| ChTry MShigh |
|
|---|
| ArgC MShigh |
|
|---|
| LysN MShigh |
|
|---|
| TryLysC MShigh |
|
|---|
General Statistics
Number of major isoforms |
Number of additional isoforms |
Number of all proteins |
Number of amino acids |
Min. Seq. Length |
Max. Seq. Length |
Avg. Seq. Length |
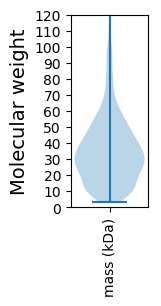
Avg. Mol. Weight |
|---|---|---|---|---|---|---|---|
0 |
771925 |
29 |
3168 |
341.7 |
37.09 |
Amino acid frequency
Ala |
Cys |
Asp |
Glu |
Phe |
Gly |
His |
Ile |
Lys |
Leu |
|---|---|---|---|---|---|---|---|---|---|
11.748 ± 0.069 | 0.886 ± 0.016 |
6.274 ± 0.05 | 5.429 ± 0.053 |
3.342 ± 0.031 | 8.197 ± 0.043 |
2.295 ± 0.024 | 5.312 ± 0.039 |
3.393 ± 0.048 | 9.131 ± 0.047 |
Met |
Asn |
Gln |
Pro |
Arg |
Ser |
Thr |
Val |
Trp |
Tyr |
|---|---|---|---|---|---|---|---|---|---|
2.519 ± 0.022 | 3.093 ± 0.03 |
4.626 ± 0.032 | 3.762 ± 0.03 |
6.324 ± 0.056 | 6.649 ± 0.046 |
5.662 ± 0.035 | 7.52 ± 0.038 |
1.291 ± 0.02 | 2.547 ± 0.028 |
Most of the basic statistics you can see at this page can be downloaded from this CSV file
See this proteome in:

Proteome-pI is available under Creative Commons Attribution-NoDerivs license, for more details see here
| Reference: Kozlowski LP. Proteome-pI 2.0: Proteome Isoelectric Point Database Update. Nucleic Acids Res. 2021, doi: 10.1093/nar/gkab944 | Contact: Lukasz P. Kozlowski |