Streptomyces radiopugnans
Taxonomy: cellular organisms; Bacteria; Terrabacteria group; Actinobacteria; Actinomycetia; Streptomycetales; Streptomycetaceae; Streptomyces
Average proteome isoelectric point is 6.47
Get precalculated fractions of proteins

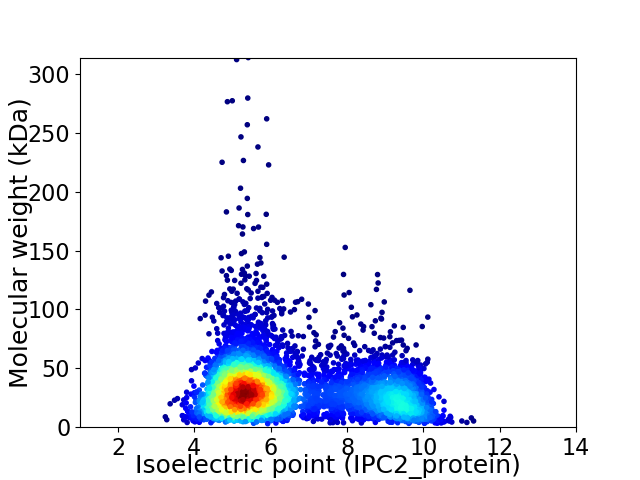
Virtual 2D-PAGE plot for 5419 proteins (isoelectric point calculated using IPC2_protein)
Get csv file with sequences according to given criteria:
* You can choose from 21 different methods for calculating isoelectric point
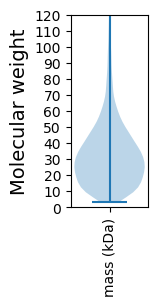
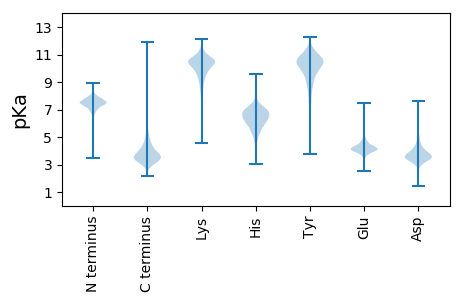
Summary statistics related to proteome-wise predictions


Protein with the lowest isoelectric point:
>tr|A0A1H9I9P1|A0A1H9I9P1_9ACTN DNA-binding response regulator NarL/FixJ family contains REC and HTH domains OS=Streptomyces radiopugnans OX=403935 GN=SAMN05216481_11390 PE=4 SV=1
MM1 pKa = 7.2SQPPPGQPPHH11 pKa = 7.33DD12 pKa = 4.11GFGPPQYY19 pKa = 10.25PGGQPQQPQQPPQQPPPPQGGPPQAPPPGYY49 pKa = 9.69GGPAAYY55 pKa = 8.58PQGGQPGYY63 pKa = 10.81AYY65 pKa = 7.36PQPGQQPPQQPYY77 pKa = 9.41GQPNPYY83 pKa = 9.82AAYY86 pKa = 8.82PPPPQAGGGSGPKK99 pKa = 8.62GTQGRR104 pKa = 11.84VALIVGGAVVALALIGGGVYY124 pKa = 10.4LAVGGDD130 pKa = 3.89DD131 pKa = 4.33GEE133 pKa = 4.61PAATAASPSPGVSSGPAEE151 pKa = 4.14EE152 pKa = 4.11TDD154 pKa = 3.64EE155 pKa = 4.61PEE157 pKa = 4.37EE158 pKa = 4.02PTEE161 pKa = 4.53EE162 pKa = 4.14PTEE165 pKa = 4.57DD166 pKa = 3.62PLGDD170 pKa = 3.55YY171 pKa = 10.74DD172 pKa = 4.6EE173 pKa = 5.14PTDD176 pKa = 3.93EE177 pKa = 5.19PVDD180 pKa = 4.18EE181 pKa = 4.78PAGAPPAQNDD191 pKa = 5.07FKK193 pKa = 11.39GQWQGEE199 pKa = 4.58GARR202 pKa = 11.84TLTVGKK208 pKa = 10.24VFEE211 pKa = 4.49SGEE214 pKa = 4.21AEE216 pKa = 4.22GKK218 pKa = 10.52NSVSWIEE225 pKa = 3.76FGGDD229 pKa = 4.33GICVGIGEE237 pKa = 4.37NQSRR241 pKa = 11.84GYY243 pKa = 10.52RR244 pKa = 11.84IALKK248 pKa = 10.42CGEE251 pKa = 4.71GDD253 pKa = 3.64DD254 pKa = 4.3EE255 pKa = 4.79EE256 pKa = 5.73YY257 pKa = 10.51IAGTASKK264 pKa = 9.31TSDD267 pKa = 3.4GEE269 pKa = 4.42SIKK272 pKa = 10.77IKK274 pKa = 9.98WDD276 pKa = 3.66DD277 pKa = 3.8GGGTDD282 pKa = 3.41TLDD285 pKa = 3.44WIGDD289 pKa = 3.92DD290 pKa = 3.91NVV292 pKa = 3.23
MM1 pKa = 7.2SQPPPGQPPHH11 pKa = 7.33DD12 pKa = 4.11GFGPPQYY19 pKa = 10.25PGGQPQQPQQPPQQPPPPQGGPPQAPPPGYY49 pKa = 9.69GGPAAYY55 pKa = 8.58PQGGQPGYY63 pKa = 10.81AYY65 pKa = 7.36PQPGQQPPQQPYY77 pKa = 9.41GQPNPYY83 pKa = 9.82AAYY86 pKa = 8.82PPPPQAGGGSGPKK99 pKa = 8.62GTQGRR104 pKa = 11.84VALIVGGAVVALALIGGGVYY124 pKa = 10.4LAVGGDD130 pKa = 3.89DD131 pKa = 4.33GEE133 pKa = 4.61PAATAASPSPGVSSGPAEE151 pKa = 4.14EE152 pKa = 4.11TDD154 pKa = 3.64EE155 pKa = 4.61PEE157 pKa = 4.37EE158 pKa = 4.02PTEE161 pKa = 4.53EE162 pKa = 4.14PTEE165 pKa = 4.57DD166 pKa = 3.62PLGDD170 pKa = 3.55YY171 pKa = 10.74DD172 pKa = 4.6EE173 pKa = 5.14PTDD176 pKa = 3.93EE177 pKa = 5.19PVDD180 pKa = 4.18EE181 pKa = 4.78PAGAPPAQNDD191 pKa = 5.07FKK193 pKa = 11.39GQWQGEE199 pKa = 4.58GARR202 pKa = 11.84TLTVGKK208 pKa = 10.24VFEE211 pKa = 4.49SGEE214 pKa = 4.21AEE216 pKa = 4.22GKK218 pKa = 10.52NSVSWIEE225 pKa = 3.76FGGDD229 pKa = 4.33GICVGIGEE237 pKa = 4.37NQSRR241 pKa = 11.84GYY243 pKa = 10.52RR244 pKa = 11.84IALKK248 pKa = 10.42CGEE251 pKa = 4.71GDD253 pKa = 3.64DD254 pKa = 4.3EE255 pKa = 4.79EE256 pKa = 5.73YY257 pKa = 10.51IAGTASKK264 pKa = 9.31TSDD267 pKa = 3.4GEE269 pKa = 4.42SIKK272 pKa = 10.77IKK274 pKa = 9.98WDD276 pKa = 3.66DD277 pKa = 3.8GGGTDD282 pKa = 3.41TLDD285 pKa = 3.44WIGDD289 pKa = 3.92DD290 pKa = 3.91NVV292 pKa = 3.23
Molecular weight: 29.71 kDa
Isoelectric point according different methods:
Protein with the highest isoelectric point:
>tr|A0A1H9CHS2|A0A1H9CHS2_9ACTN Protein SCO1/2 OS=Streptomyces radiopugnans OX=403935 GN=SAMN05216481_103249 PE=3 SV=1
MM1 pKa = 7.69SKK3 pKa = 9.0RR4 pKa = 11.84TFQPNNRR11 pKa = 11.84RR12 pKa = 11.84RR13 pKa = 11.84AKK15 pKa = 8.7THH17 pKa = 5.15GFRR20 pKa = 11.84LRR22 pKa = 11.84MRR24 pKa = 11.84TRR26 pKa = 11.84AGRR29 pKa = 11.84AILASRR35 pKa = 11.84RR36 pKa = 11.84SKK38 pKa = 10.75GRR40 pKa = 11.84ARR42 pKa = 11.84LSAA45 pKa = 3.91
MM1 pKa = 7.69SKK3 pKa = 9.0RR4 pKa = 11.84TFQPNNRR11 pKa = 11.84RR12 pKa = 11.84RR13 pKa = 11.84AKK15 pKa = 8.7THH17 pKa = 5.15GFRR20 pKa = 11.84LRR22 pKa = 11.84MRR24 pKa = 11.84TRR26 pKa = 11.84AGRR29 pKa = 11.84AILASRR35 pKa = 11.84RR36 pKa = 11.84SKK38 pKa = 10.75GRR40 pKa = 11.84ARR42 pKa = 11.84LSAA45 pKa = 3.91
Molecular weight: 5.28 kDa
Isoelectric point according different methods:
Peptides (in silico digests for buttom-up proteomics)
Below you can find in silico digests of the whole proteome with Trypsin, Chymotrypsin, Trypsin+LysC, LysN, ArgC proteases suitable for different mass spec machines.| Try ESI |
 |
|---|
| ChTry ESI |
 |
|---|
| ArgC ESI |
 |
|---|
| LysN ESI |
 |
|---|
| TryLysC ESI |
 |
|---|
| Try MALDI |
 |
|---|
| ChTry MALDI |
 |
|---|
| ArgC MALDI |
 |
|---|
| LysN MALDI |
 |
|---|
| TryLysC MALDI |
 |
|---|
| Try LTQ |
 |
|---|
| ChTry LTQ |
 |
|---|
| ArgC LTQ |
 |
|---|
| LysN LTQ |
 |
|---|
| TryLysC LTQ |
 |
|---|
| Try MSlow |
 |
|---|
| ChTry MSlow |
 |
|---|
| ArgC MSlow |
 |
|---|
| LysN MSlow |
 |
|---|
| TryLysC MSlow |
 |
|---|
| Try MShigh |
 |
|---|
| ChTry MShigh |
 |
|---|
| ArgC MShigh |
 |
|---|
| LysN MShigh |
 |
|---|
| TryLysC MShigh |
 |
|---|
General Statistics
Number of major isoforms |
Number of additional isoforms |
Number of all proteins |
Number of amino acids |
Min. Seq. Length |
Max. Seq. Length |
Avg. Seq. Length |
Avg. Mol. Weight |
|---|---|---|---|---|---|---|---|
0 |
1754213 |
30 |
2920 |
323.7 |
34.58 |
Amino acid frequency
Ala |
Cys |
Asp |
Glu |
Phe |
Gly |
His |
Ile |
Lys |
Leu |
|---|---|---|---|---|---|---|---|---|---|
13.868 ± 0.059 | 0.811 ± 0.01 |
5.835 ± 0.024 | 6.317 ± 0.033 |
2.546 ± 0.019 | 10.194 ± 0.037 |
2.248 ± 0.017 | 2.78 ± 0.022 |
1.841 ± 0.026 | 10.095 ± 0.043 |
Met |
Asn |
Gln |
Pro |
Arg |
Ser |
Thr |
Val |
Trp |
Tyr |
|---|---|---|---|---|---|---|---|---|---|
1.695 ± 0.014 | 1.611 ± 0.02 |
6.4 ± 0.035 | 2.386 ± 0.021 |
8.896 ± 0.047 | 4.799 ± 0.024 |
5.791 ± 0.038 | 8.408 ± 0.031 |
1.475 ± 0.015 | 2.003 ± 0.019 |
Most of the basic statistics you can see at this page can be downloaded from this CSV file
Proteome-pI is available under Creative Commons Attribution-NoDerivs license, for more details see here
| Reference: Kozlowski LP. Proteome-pI 2.0: Proteome Isoelectric Point Database Update. Nucleic Acids Res. 2021, doi: 10.1093/nar/gkab944 | Contact: Lukasz P. Kozlowski |
