Rhizobium sp. Root482
Taxonomy: cellular organisms; Bacteria; Proteobacteria; Alphaproteobacteria; Hyphomicrobiales; Rhizobiaceae; Rhizobium/Agrobacterium group; Rhizobium; unclassified Rhizobium
Average proteome isoelectric point is 6.39
Get precalculated fractions of proteins

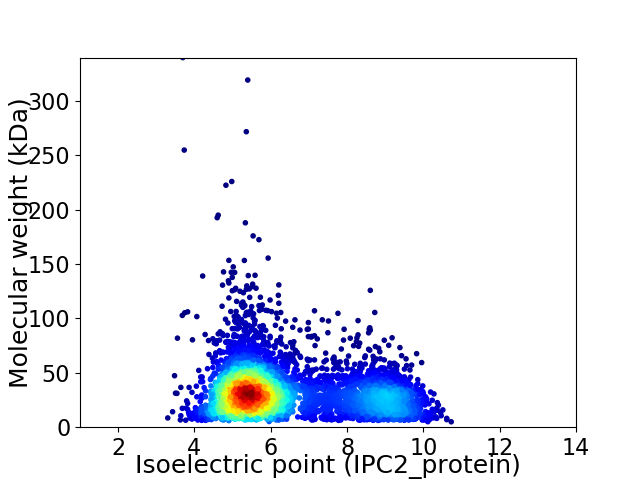
Virtual 2D-PAGE plot for 4853 proteins (isoelectric point calculated using IPC2_protein)
Get csv file with sequences according to given criteria:
* You can choose from 21 different methods for calculating isoelectric point
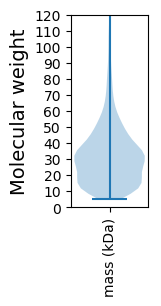
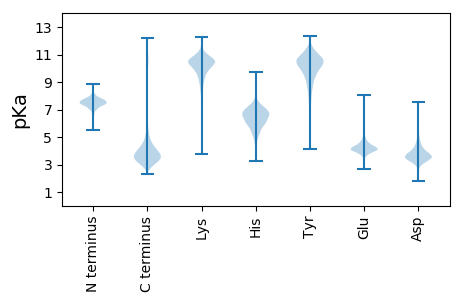
Summary statistics related to proteome-wise predictions


Protein with the lowest isoelectric point:
>tr|A0A0T1X5T9|A0A0T1X5T9_9RHIZ Transcriptional regulator OS=Rhizobium sp. Root482 OX=1736543 GN=ASD31_05080 PE=3 SV=1
MM1 pKa = 7.49NIKK4 pKa = 10.39SLLLGSAAALAAVSGAQAADD24 pKa = 4.21AIVAAEE30 pKa = 4.47PEE32 pKa = 3.93PMEE35 pKa = 4.1YY36 pKa = 10.8VRR38 pKa = 11.84VCDD41 pKa = 4.42AFGTGYY47 pKa = 10.47FYY49 pKa = 10.57IPGTEE54 pKa = 3.81TCLKK58 pKa = 9.11VGGYY62 pKa = 9.73VRR64 pKa = 11.84TQINYY69 pKa = 9.02IDD71 pKa = 4.37NDD73 pKa = 4.23SGSDD77 pKa = 3.43AADD80 pKa = 2.9WDD82 pKa = 4.04ARR84 pKa = 11.84TKK86 pKa = 10.95GYY88 pKa = 8.86LTFAAKK94 pKa = 10.39NDD96 pKa = 3.95TEE98 pKa = 4.3IGTVSAYY105 pKa = 9.97INLEE109 pKa = 3.4AWDD112 pKa = 4.28NDD114 pKa = 4.13DD115 pKa = 5.71GNLLDD120 pKa = 4.42GAWINVAGFDD130 pKa = 4.28IGYY133 pKa = 9.63FYY135 pKa = 11.33NWWDD139 pKa = 3.64DD140 pKa = 3.77FGLSGEE146 pKa = 4.66TDD148 pKa = 2.84WADD151 pKa = 4.16NGNTLHH157 pKa = 6.36NAVRR161 pKa = 11.84YY162 pKa = 9.76VYY164 pKa = 10.73DD165 pKa = 3.9GGSFQAGLAVEE176 pKa = 4.3EE177 pKa = 4.81LSDD180 pKa = 3.62VLYY183 pKa = 10.91DD184 pKa = 4.2AGTNDD189 pKa = 4.94DD190 pKa = 4.16VGLSALIRR198 pKa = 11.84GTVGGVDD205 pKa = 3.42ALLIASYY212 pKa = 11.31DD213 pKa = 3.54FDD215 pKa = 4.97AEE217 pKa = 3.94EE218 pKa = 4.1AAFKK222 pKa = 11.0ARR224 pKa = 11.84LTADD228 pKa = 4.64LGPGTLGILGVYY240 pKa = 8.58ATDD243 pKa = 5.06PNAFWDD249 pKa = 3.43ISEE252 pKa = 4.06WSVAAEE258 pKa = 4.01YY259 pKa = 10.28KK260 pKa = 10.33IQATEE265 pKa = 3.93KK266 pKa = 10.92LFITPAVQYY275 pKa = 10.09FGDD278 pKa = 3.97YY279 pKa = 9.25GTVGTAALDD288 pKa = 3.72TLDD291 pKa = 5.18FGGDD295 pKa = 3.51DD296 pKa = 3.33AWRR299 pKa = 11.84VGITAGYY306 pKa = 9.79QITEE310 pKa = 4.19GLRR313 pKa = 11.84TLATVNYY320 pKa = 8.86TDD322 pKa = 4.8VDD324 pKa = 3.92GDD326 pKa = 5.87DD327 pKa = 4.48DD328 pKa = 4.38GTWDD332 pKa = 3.89GFLRR336 pKa = 11.84LQRR339 pKa = 11.84DD340 pKa = 3.78FF341 pKa = 4.66
MM1 pKa = 7.49NIKK4 pKa = 10.39SLLLGSAAALAAVSGAQAADD24 pKa = 4.21AIVAAEE30 pKa = 4.47PEE32 pKa = 3.93PMEE35 pKa = 4.1YY36 pKa = 10.8VRR38 pKa = 11.84VCDD41 pKa = 4.42AFGTGYY47 pKa = 10.47FYY49 pKa = 10.57IPGTEE54 pKa = 3.81TCLKK58 pKa = 9.11VGGYY62 pKa = 9.73VRR64 pKa = 11.84TQINYY69 pKa = 9.02IDD71 pKa = 4.37NDD73 pKa = 4.23SGSDD77 pKa = 3.43AADD80 pKa = 2.9WDD82 pKa = 4.04ARR84 pKa = 11.84TKK86 pKa = 10.95GYY88 pKa = 8.86LTFAAKK94 pKa = 10.39NDD96 pKa = 3.95TEE98 pKa = 4.3IGTVSAYY105 pKa = 9.97INLEE109 pKa = 3.4AWDD112 pKa = 4.28NDD114 pKa = 4.13DD115 pKa = 5.71GNLLDD120 pKa = 4.42GAWINVAGFDD130 pKa = 4.28IGYY133 pKa = 9.63FYY135 pKa = 11.33NWWDD139 pKa = 3.64DD140 pKa = 3.77FGLSGEE146 pKa = 4.66TDD148 pKa = 2.84WADD151 pKa = 4.16NGNTLHH157 pKa = 6.36NAVRR161 pKa = 11.84YY162 pKa = 9.76VYY164 pKa = 10.73DD165 pKa = 3.9GGSFQAGLAVEE176 pKa = 4.3EE177 pKa = 4.81LSDD180 pKa = 3.62VLYY183 pKa = 10.91DD184 pKa = 4.2AGTNDD189 pKa = 4.94DD190 pKa = 4.16VGLSALIRR198 pKa = 11.84GTVGGVDD205 pKa = 3.42ALLIASYY212 pKa = 11.31DD213 pKa = 3.54FDD215 pKa = 4.97AEE217 pKa = 3.94EE218 pKa = 4.1AAFKK222 pKa = 11.0ARR224 pKa = 11.84LTADD228 pKa = 4.64LGPGTLGILGVYY240 pKa = 8.58ATDD243 pKa = 5.06PNAFWDD249 pKa = 3.43ISEE252 pKa = 4.06WSVAAEE258 pKa = 4.01YY259 pKa = 10.28KK260 pKa = 10.33IQATEE265 pKa = 3.93KK266 pKa = 10.92LFITPAVQYY275 pKa = 10.09FGDD278 pKa = 3.97YY279 pKa = 9.25GTVGTAALDD288 pKa = 3.72TLDD291 pKa = 5.18FGGDD295 pKa = 3.51DD296 pKa = 3.33AWRR299 pKa = 11.84VGITAGYY306 pKa = 9.79QITEE310 pKa = 4.19GLRR313 pKa = 11.84TLATVNYY320 pKa = 8.86TDD322 pKa = 4.8VDD324 pKa = 3.92GDD326 pKa = 5.87DD327 pKa = 4.48DD328 pKa = 4.38GTWDD332 pKa = 3.89GFLRR336 pKa = 11.84LQRR339 pKa = 11.84DD340 pKa = 3.78FF341 pKa = 4.66
Molecular weight: 36.61 kDa
Isoelectric point according different methods:
Protein with the highest isoelectric point:
>tr|A0A0T1WQU2|A0A0T1WQU2_9RHIZ EamA domain-containing protein OS=Rhizobium sp. Root482 OX=1736543 GN=ASD31_15215 PE=4 SV=1
MM1 pKa = 7.59RR2 pKa = 11.84PAVNVKK8 pKa = 10.2SVTSNVGWSILSKK21 pKa = 10.05TSTFGLKK28 pKa = 9.98FVTVPILARR37 pKa = 11.84LLSPQEE43 pKa = 3.99FGAVAVALTVVQFLAMIGGAGLTSALVIQRR73 pKa = 11.84DD74 pKa = 3.67EE75 pKa = 4.19NMEE78 pKa = 4.24TVHH81 pKa = 7.15SVFWANLAISCLMALGLFLSADD103 pKa = 3.95LFAAFLGAPEE113 pKa = 4.52AAPLLRR119 pKa = 11.84VMSFLIPLQLGGDD132 pKa = 3.57VAYY135 pKa = 10.59ALLARR140 pKa = 11.84RR141 pKa = 11.84MNFSKK146 pKa = 10.89DD147 pKa = 3.63AVWSMISEE155 pKa = 4.22SLGAVVAVVMALFGWGVWALMAQLFVSALVRR186 pKa = 11.84LCGLFAVSHH195 pKa = 4.78YY196 pKa = 10.4RR197 pKa = 11.84PRR199 pKa = 11.84LVFQLRR205 pKa = 11.84RR206 pKa = 11.84VLALSRR212 pKa = 11.84FSLGMMGSEE221 pKa = 3.96VANFITFQSPMVVVSRR237 pKa = 11.84ALGLADD243 pKa = 3.99AGAYY247 pKa = 9.43SAANRR252 pKa = 11.84FASIPNQIVLSAVMGVLFPAFSGMMDD278 pKa = 3.2DD279 pKa = 4.87RR280 pKa = 11.84EE281 pKa = 4.17RR282 pKa = 11.84RR283 pKa = 11.84SQALMFSTQVTTVLLAPMMFGLWAVAEE310 pKa = 4.0PAMRR314 pKa = 11.84VLFGPQWAYY323 pKa = 10.32AWPVLGLLALSKK335 pKa = 11.06GILTPCSTFIPYY347 pKa = 10.52LKK349 pKa = 10.64GAGHH353 pKa = 6.42GRR355 pKa = 11.84ALFWSAIIRR364 pKa = 11.84AVATTAAVAYY374 pKa = 8.23GASTGGLTGAMIWLCIVNGLTLIGYY399 pKa = 8.68SRR401 pKa = 11.84VVFRR405 pKa = 11.84ADD407 pKa = 2.83GRR409 pKa = 11.84PFLKK413 pKa = 10.63GLAISSRR420 pKa = 11.84PMLTAFVMALAVRR433 pKa = 11.84LLLNAGAEE441 pKa = 4.07LLPNPVLQILAGAACGGVIYY461 pKa = 10.61AGLIFLTEE469 pKa = 4.05RR470 pKa = 11.84PLLLKK475 pKa = 10.31IHH477 pKa = 5.9QLVKK481 pKa = 10.58KK482 pKa = 9.44PRR484 pKa = 11.84QDD486 pKa = 3.1RR487 pKa = 11.84TQGTGG492 pKa = 2.81
MM1 pKa = 7.59RR2 pKa = 11.84PAVNVKK8 pKa = 10.2SVTSNVGWSILSKK21 pKa = 10.05TSTFGLKK28 pKa = 9.98FVTVPILARR37 pKa = 11.84LLSPQEE43 pKa = 3.99FGAVAVALTVVQFLAMIGGAGLTSALVIQRR73 pKa = 11.84DD74 pKa = 3.67EE75 pKa = 4.19NMEE78 pKa = 4.24TVHH81 pKa = 7.15SVFWANLAISCLMALGLFLSADD103 pKa = 3.95LFAAFLGAPEE113 pKa = 4.52AAPLLRR119 pKa = 11.84VMSFLIPLQLGGDD132 pKa = 3.57VAYY135 pKa = 10.59ALLARR140 pKa = 11.84RR141 pKa = 11.84MNFSKK146 pKa = 10.89DD147 pKa = 3.63AVWSMISEE155 pKa = 4.22SLGAVVAVVMALFGWGVWALMAQLFVSALVRR186 pKa = 11.84LCGLFAVSHH195 pKa = 4.78YY196 pKa = 10.4RR197 pKa = 11.84PRR199 pKa = 11.84LVFQLRR205 pKa = 11.84RR206 pKa = 11.84VLALSRR212 pKa = 11.84FSLGMMGSEE221 pKa = 3.96VANFITFQSPMVVVSRR237 pKa = 11.84ALGLADD243 pKa = 3.99AGAYY247 pKa = 9.43SAANRR252 pKa = 11.84FASIPNQIVLSAVMGVLFPAFSGMMDD278 pKa = 3.2DD279 pKa = 4.87RR280 pKa = 11.84EE281 pKa = 4.17RR282 pKa = 11.84RR283 pKa = 11.84SQALMFSTQVTTVLLAPMMFGLWAVAEE310 pKa = 4.0PAMRR314 pKa = 11.84VLFGPQWAYY323 pKa = 10.32AWPVLGLLALSKK335 pKa = 11.06GILTPCSTFIPYY347 pKa = 10.52LKK349 pKa = 10.64GAGHH353 pKa = 6.42GRR355 pKa = 11.84ALFWSAIIRR364 pKa = 11.84AVATTAAVAYY374 pKa = 8.23GASTGGLTGAMIWLCIVNGLTLIGYY399 pKa = 8.68SRR401 pKa = 11.84VVFRR405 pKa = 11.84ADD407 pKa = 2.83GRR409 pKa = 11.84PFLKK413 pKa = 10.63GLAISSRR420 pKa = 11.84PMLTAFVMALAVRR433 pKa = 11.84LLLNAGAEE441 pKa = 4.07LLPNPVLQILAGAACGGVIYY461 pKa = 10.61AGLIFLTEE469 pKa = 4.05RR470 pKa = 11.84PLLLKK475 pKa = 10.31IHH477 pKa = 5.9QLVKK481 pKa = 10.58KK482 pKa = 9.44PRR484 pKa = 11.84QDD486 pKa = 3.1RR487 pKa = 11.84TQGTGG492 pKa = 2.81
Molecular weight: 52.6 kDa
Isoelectric point according different methods:
Peptides (in silico digests for buttom-up proteomics)
Below you can find in silico digests of the whole proteome with Trypsin, Chymotrypsin, Trypsin+LysC, LysN, ArgC proteases suitable for different mass spec machines.| Try ESI |
 |
|---|
| ChTry ESI |
 |
|---|
| ArgC ESI |
 |
|---|
| LysN ESI |
 |
|---|
| TryLysC ESI |
 |
|---|
| Try MALDI |
 |
|---|
| ChTry MALDI |
 |
|---|
| ArgC MALDI |
 |
|---|
| LysN MALDI |
 |
|---|
| TryLysC MALDI |
 |
|---|
| Try LTQ |
 |
|---|
| ChTry LTQ |
 |
|---|
| ArgC LTQ |
 |
|---|
| LysN LTQ |
 |
|---|
| TryLysC LTQ |
 |
|---|
| Try MSlow |
 |
|---|
| ChTry MSlow |
 |
|---|
| ArgC MSlow |
 |
|---|
| LysN MSlow |
 |
|---|
| TryLysC MSlow |
 |
|---|
| Try MShigh |
 |
|---|
| ChTry MShigh |
 |
|---|
| ArgC MShigh |
 |
|---|
| LysN MShigh |
 |
|---|
| TryLysC MShigh |
 |
|---|
General Statistics
Number of major isoforms |
Number of additional isoforms |
Number of all proteins |
Number of amino acids |
Min. Seq. Length |
Max. Seq. Length |
Avg. Seq. Length |
Avg. Mol. Weight |
|---|---|---|---|---|---|---|---|
0 |
1502100 |
41 |
3256 |
309.5 |
33.66 |
Amino acid frequency
Ala |
Cys |
Asp |
Glu |
Phe |
Gly |
His |
Ile |
Lys |
Leu |
|---|---|---|---|---|---|---|---|---|---|
11.921 ± 0.043 | 0.813 ± 0.01 |
5.836 ± 0.038 | 5.813 ± 0.033 |
3.925 ± 0.024 | 8.483 ± 0.034 |
2.015 ± 0.017 | 5.728 ± 0.024 |
3.61 ± 0.027 | 10.019 ± 0.047 |
Met |
Asn |
Gln |
Pro |
Arg |
Ser |
Thr |
Val |
Trp |
Tyr |
|---|---|---|---|---|---|---|---|---|---|
2.635 ± 0.016 | 2.774 ± 0.022 |
4.822 ± 0.024 | 3.07 ± 0.02 |
6.755 ± 0.034 | 5.717 ± 0.025 |
5.363 ± 0.024 | 7.209 ± 0.028 |
1.238 ± 0.014 | 2.254 ± 0.016 |
Most of the basic statistics you can see at this page can be downloaded from this CSV file
Proteome-pI is available under Creative Commons Attribution-NoDerivs license, for more details see here
| Reference: Kozlowski LP. Proteome-pI 2.0: Proteome Isoelectric Point Database Update. Nucleic Acids Res. 2021, doi: 10.1093/nar/gkab944 | Contact: Lukasz P. Kozlowski |
